Currencies move in packs, not in isolation, and raw numbers don’t show that very well. A forex heatmap turns all that motion into something you can grasp at a glance. You see what’s strong, what’s weak, and what’s going on, without staring at spreadsheets.
When you see the whole market at once, patterns jump out with just a glance. This is why traders rely on visual tools instead of isolated prices. It’s more like checking the weather than trying to make sense of a messy spreadsheet.
In this guide, you will build a forex heatmap using CurrencyFreaks for data and D3.js for visuals. The goal is clarity, not decoration. By the end, you will know how to turn live currency data into a clean and useful view for the forex market.
What are Forex Heatmaps And How They Work
A Forex heatmap shows how currencies perform against each other over a specific period. Each cell compares a base and a quote from multiple currency pairs and uses different colors to reflect movement. This helps explain complex foreign exchange trading relationships visually.
Relative performance matters more than raw price movement. A currency can rise yet still trail others in the same session. A heatmap highlights the strongest and weakest currencies instantly using contrast.
The grid layout pulls everything into one place. Rows and columns show how things connect, and the colors make the direction clear. It works the same whether you’re watching quick moves or bigger, slower shifts.
Why Use A Forex Heatmap For Currency Analysis
Speed matters when markets move fast. A heatmap lets forex traders spot changes right away instead of flipping through charts. That quick view really helps when forex currency volatility picks up.
Patterns stand out when pairs align or diverge. You can spot correlation, imbalance, or strength without switching screens. For most forex traders, it helps confirm direction faster.
Common reasons traders rely on this view include:
-
Identifying the dominant and weakest currencies
-
Confirming trend direction before a trade
-
Reducing noise from single price moves
-
Comparing many assets inside one heat map
Tools And Why CurrencyFreaks + D3.js
CurrencyFreaks supplies the data: live and historical FX rates across major currencies, plus a fluctuation endpoint that returns the percent change between two dates directly - exactly the "how much did this currency move" number a heatmap needs, without you calculating it yourself.
D3.js handles the visuals. It binds data straight to SVG elements, so when the data updates, only the cells that changed re-render. No framework, no build step - just an HTML file, D3 loaded from a CDN, and a <script> tag.
Building The Heatmap: Fetching Data
The heatmap compares a fixed list of major currencies against a base currency the user picks from a dropdown. The fluctuation endpoint takes a startDate, endDate, base, and symbols list, and returns each symbol's start rate, end rate, and percent change over that window:
const CURRENCIES = ['USD', 'EUR', 'GBP', 'JPY', 'CHF', 'CAD', 'AUD', 'NZD'];
const API_KEY = 'YOUR_API_KEY';

function isoDate(daysAgo = 0) {
  const d = new Date();
  d.setDate(d.getDate() - daysAgo);
  return d.toISOString().slice(0, 10);
}

async function fetchFluctuation(base) {
  const symbols = CURRENCIES.filter((c) => c !== base).join(',');
  const url =
    `https://api.currencyfreaks.com/v2.0/fluctuation?apikey=${API_KEY}` +
    `&startDate=${isoDate(1)}&endDate=${isoDate(0)}&base=${base}&symbols=${symbols}`;

  const res = await fetch(url);
  if (!res.ok) throw new Error(`API error: ${res.status}`);
  const data = await res.json();
  return data.rateFluctuations; // { EUR: { percentChange: "0.34", ... }, ... }
}
Requesting a 24-hour window (yesterday to today) gives a "currency strength since yesterday" reading. Widen the date range for a longer-term view of the same grid.
Building The Heatmap: Rendering With D3.js
Each currency becomes one colored cell. A diverging color scale maps negative percent change to red and positive to green, with a neutral color at zero:
function renderHeatmap(base, fluctuations) {
  const container = d3.select('#heatmap');
  container.selectAll('*').remove();

  const cellData = Object.entries(fluctuations).map(([code, v]) => ({
    code,
    percentChange: parseFloat(v.percentChange),
  }));

  const cellSize = 90;
  const svg = container
    .append('svg')
    .attr('width', cellSize * cellData.length)
    .attr('height', cellSize);

  const color = d3.scaleLinear()
    .domain([-2, 0, 2]) // percent change, clamped at +/-2%
    .range(['#c62828', '#333', '#2e7d32'])
    .clamp(true);

  svg.selectAll('rect')
    .data(cellData)
    .join('rect')
    .attr('x', (d, i) => i * cellSize)
    .attr('width', cellSize - 4)
    .attr('height', cellSize)
    .attr('fill', (d) => color(d.percentChange));

  svg.selectAll('text')
    .data(cellData)
    .join('text')
    .attr('x', (d, i) => i * cellSize + (cellSize - 4) / 2)
    .attr('y', cellSize / 2)
    .attr('text-anchor', 'middle')
    .attr('dominant-baseline', 'middle')
    .attr('fill', '#fff')
    .attr('font-weight', 'bold')
    .text((d) => d.code);
}
Since .join('rect') re-binds to the same data each call, re-running this after a refresh only updates cells whose values actually changed - D3 diffs the data for you.
Adding Interactivity And CSV Export
A hover tooltip shows the exact percent change, a click writes a plain-language summary into the report box, and an export button downloads the current grid as a CSV:
function attachInteractivity(base) {
  const tooltip = d3.select('#tooltip');

  d3.select('#heatmap').selectAll('rect')
    .on('mousemove', (event, d) => {
      tooltip
        .style('opacity', 1)
        .style('left', `${event.pageX + 12}px`)
        .style('top', `${event.pageY - 20}px`)
        .html(`<strong>${base}/${d.code}</strong><br>${d.percentChange.toFixed(2)}%`);
    })
    .on('mouseleave', () => tooltip.style('opacity', 0))
    .on('click', (event, d) => {
      const direction = d.percentChange >= 0 ? 'stronger' : 'weaker';
      document.getElementById('reportContent').textContent =
        `${d.code} is ${Math.abs(d.percentChange).toFixed(2)}% ${direction} against ${base} over the last 24 hours.`;
    });
}

function exportCSV(base, fluctuations) {
  const rows = [['Currency', 'Base', 'PercentChange']];
  Object.entries(fluctuations).forEach(([code, v]) => rows.push([code, base, v.percentChange]));

  const blob = new Blob([rows.map((r) => r.join(',')).join('\n')], { type: 'text/csv' });
  const a = document.createElement('a');
  a.href = URL.createObjectURL(blob);
  a.download = `heatmap-${base}-${isoDate()}.csv`;
  a.click();
  URL.revokeObjectURL(a.href);
}
Complete Code
This ties the pieces above together into one runnable file. Two functions here haven't shown up yet:
populateBaseSelector()fills the dropdown with theCURRENCIESlist on page load, defaulting to USD.updateHeatmap()is the orchestrator: it reads the selected base currency, shows a "Loading..." message, callsfetchFluctuation, then hands the result torenderHeatmap. If the fetch fails, it swaps in an error message instead of leaving a blank grid.
In the HTML, #baseCurrency and the two buttons are the controls; #heatmap is where D3 draws the SVG cells; #tooltip and .report-box are the mount points the JS above writes into on hover and click. The <style> block only sets the dark card theme - no layout logic lives there.
At the bottom, populateBaseSelector() and updateHeatmap() run once on load so the grid renders immediately, and updateHeatmap() runs again whenever "Refresh Heatmap" is clicked. The full project is also on GitHub.
<!DOCTYPE html>
<html lang="en">
<head>
    <meta charset="UTF-8">
    <title>Forex Heatmap: CurrencyFreaks & D3.js</title>
    <script src="https://cdn.jsdelivr.net/npm/d3@7/dist/d3.min.js"></script>
    <style>
        body { font-family: 'Inter', sans-serif; background: #121212; color: #e0e0e0; margin: 20px; }
        .card { background: #1e1e1e; padding: 25px; border-radius: 12px; box-shadow: 0 4px 20px rgba(0,0,0,0.5); max-width: 900px; margin: auto; }
        header { text-align: center; margin-bottom: 20px; }
        .controls { display: flex; justify-content: center; gap: 10px; margin-bottom: 25px; }
        select, button { padding: 10px; border-radius: 5px; border: 1px solid #333; background: #252525; color: white; }
        button { background: #388e3c; cursor: pointer; border: none; font-weight: bold; }
        #heatmap { display: flex; justify-content: center; }
        .report-box { margin-top: 25px; padding: 15px; background: #252525; border-left: 4px solid #388e3c; border-radius: 4px; }
        .tooltip { position: absolute; background: rgba(0,0,0,0.9); padding: 8px; border-radius: 4px; font-size: 12px; pointer-events: none; opacity: 0; border: 1px solid #444; }
        rect:hover { stroke: #fff; stroke-width: 2px; }
    </style>
</head>
<body>

<div class="card">
    <header>
        <h1>Forex Market Heatmap</h1>
        <p>24-Hour Currency Strength</p>
    </header>

    <div class="controls">
        <select id="baseCurrency"></select>
        <button onclick="updateHeatmap()">Refresh Heatmap</button>
        <button onclick="exportCSV(lastBase, lastFluctuations)">Export CSV</button>
    </div>

    <div id="heatmap"></div>
    <div id="tooltip" class="tooltip"></div>

    <div class="report-box" id="report">
        <strong>Market Insights:</strong>
        <p id="reportContent">Select a base currency to analyze relative strength.</p>
    </div>
</div>

<script>
  const CURRENCIES = ['USD', 'EUR', 'GBP', 'JPY', 'CHF', 'CAD', 'AUD', 'NZD'];
  const API_KEY = 'YOUR_API_KEY'; // Replace with your CurrencyFreaks API key

  let lastBase = null;
  let lastFluctuations = null;

  function isoDate(daysAgo = 0) {
    const d = new Date();
    d.setDate(d.getDate() - daysAgo);
    return d.toISOString().slice(0, 10);
  }

  function populateBaseSelector() {
    const select = document.getElementById('baseCurrency');
    CURRENCIES.forEach((code) => {
      const opt = document.createElement('option');
      opt.value = code;
      opt.textContent = code;
      select.appendChild(opt);
    });
    select.value = 'USD';
  }

  async function fetchFluctuation(base) {
    const symbols = CURRENCIES.filter((c) => c !== base).join(',');
    const url =
      `https://api.currencyfreaks.com/v2.0/fluctuation?apikey=${API_KEY}` +
      `&startDate=${isoDate(1)}&endDate=${isoDate(0)}&base=${base}&symbols=${symbols}`;
    const res = await fetch(url);
    if (!res.ok) throw new Error(`API error: ${res.status}`);
    const data = await res.json();
    return data.rateFluctuations;
  }

  function renderHeatmap(base, fluctuations) {
    const container = d3.select('#heatmap');
    container.selectAll('*').remove();

    const cellData = Object.entries(fluctuations).map(([code, v]) => ({
      code,
      percentChange: parseFloat(v.percentChange),
    }));

    const cellSize = 90;
    const svg = container.append('svg')
      .attr('width', cellSize * cellData.length)
      .attr('height', cellSize);

    const color = d3.scaleLinear()
      .domain([-2, 0, 2])
      .range(['#c62828', '#333', '#2e7d32'])
      .clamp(true);

    svg.selectAll('rect')
      .data(cellData)
      .join('rect')
      .attr('x', (d, i) => i * cellSize)
      .attr('width', cellSize - 4)
      .attr('height', cellSize)
      .attr('fill', (d) => color(d.percentChange));

    svg.selectAll('text')
      .data(cellData)
      .join('text')
      .attr('x', (d, i) => i * cellSize + (cellSize - 4) / 2)
      .attr('y', cellSize / 2)
      .attr('text-anchor', 'middle')
      .attr('dominant-baseline', 'middle')
      .attr('fill', '#fff')
      .attr('font-weight', 'bold')
      .text((d) => d.code);

    attachInteractivity(base);
  }

  function attachInteractivity(base) {
    const tooltip = d3.select('#tooltip');

    d3.select('#heatmap').selectAll('rect')
      .on('mousemove', (event, d) => {
        tooltip
          .style('opacity', 1)
          .style('left', `${event.pageX + 12}px`)
          .style('top', `${event.pageY - 20}px`)
          .html(`<strong>${base}/${d.code}</strong><br>${d.percentChange.toFixed(2)}%`);
      })
      .on('mouseleave', () => tooltip.style('opacity', 0))
      .on('click', (event, d) => {
        const direction = d.percentChange >= 0 ? 'stronger' : 'weaker';
        document.getElementById('reportContent').textContent =
          `${d.code} is ${Math.abs(d.percentChange).toFixed(2)}% ${direction} against ${base} over the last 24 hours.`;
      });
  }

  function exportCSV(base, fluctuations) {
    if (!fluctuations) return;
    const rows = [['Currency', 'Base', 'PercentChange']];
    Object.entries(fluctuations).forEach(([code, v]) => rows.push([code, base, v.percentChange]));
    const blob = new Blob([rows.map((r) => r.join(',')).join('\n')], { type: 'text/csv' });
    const a = document.createElement('a');
    a.href = URL.createObjectURL(blob);
    a.download = `heatmap-${base}-${isoDate()}.csv`;
    a.click();
    URL.revokeObjectURL(a.href);
  }

  async function updateHeatmap() {
    const base = document.getElementById('baseCurrency').value;
    document.getElementById('reportContent').textContent = 'Loading...';
    try {
      const fluctuations = await fetchFluctuation(base);
      lastBase = base;
      lastFluctuations = fluctuations;
      renderHeatmap(base, fluctuations);
      document.getElementById('reportContent').textContent =
        `Showing 24h currency strength relative to ${base}. Click a cell for details.`;
    } catch (err) {
      document.getElementById('reportContent').textContent =
        'Could not load heatmap data. Check your API key and try again.';
    }
  }

  populateBaseSelector();
  updateHeatmap();
</script>
</body>
</html>
Note: this demo puts the API key directly in client-side JavaScript for simplicity. For a production site, proxy the fluctuation request through your own backend so the key never reaches the browser (see error handling and backend patterns for the general approach).
Output
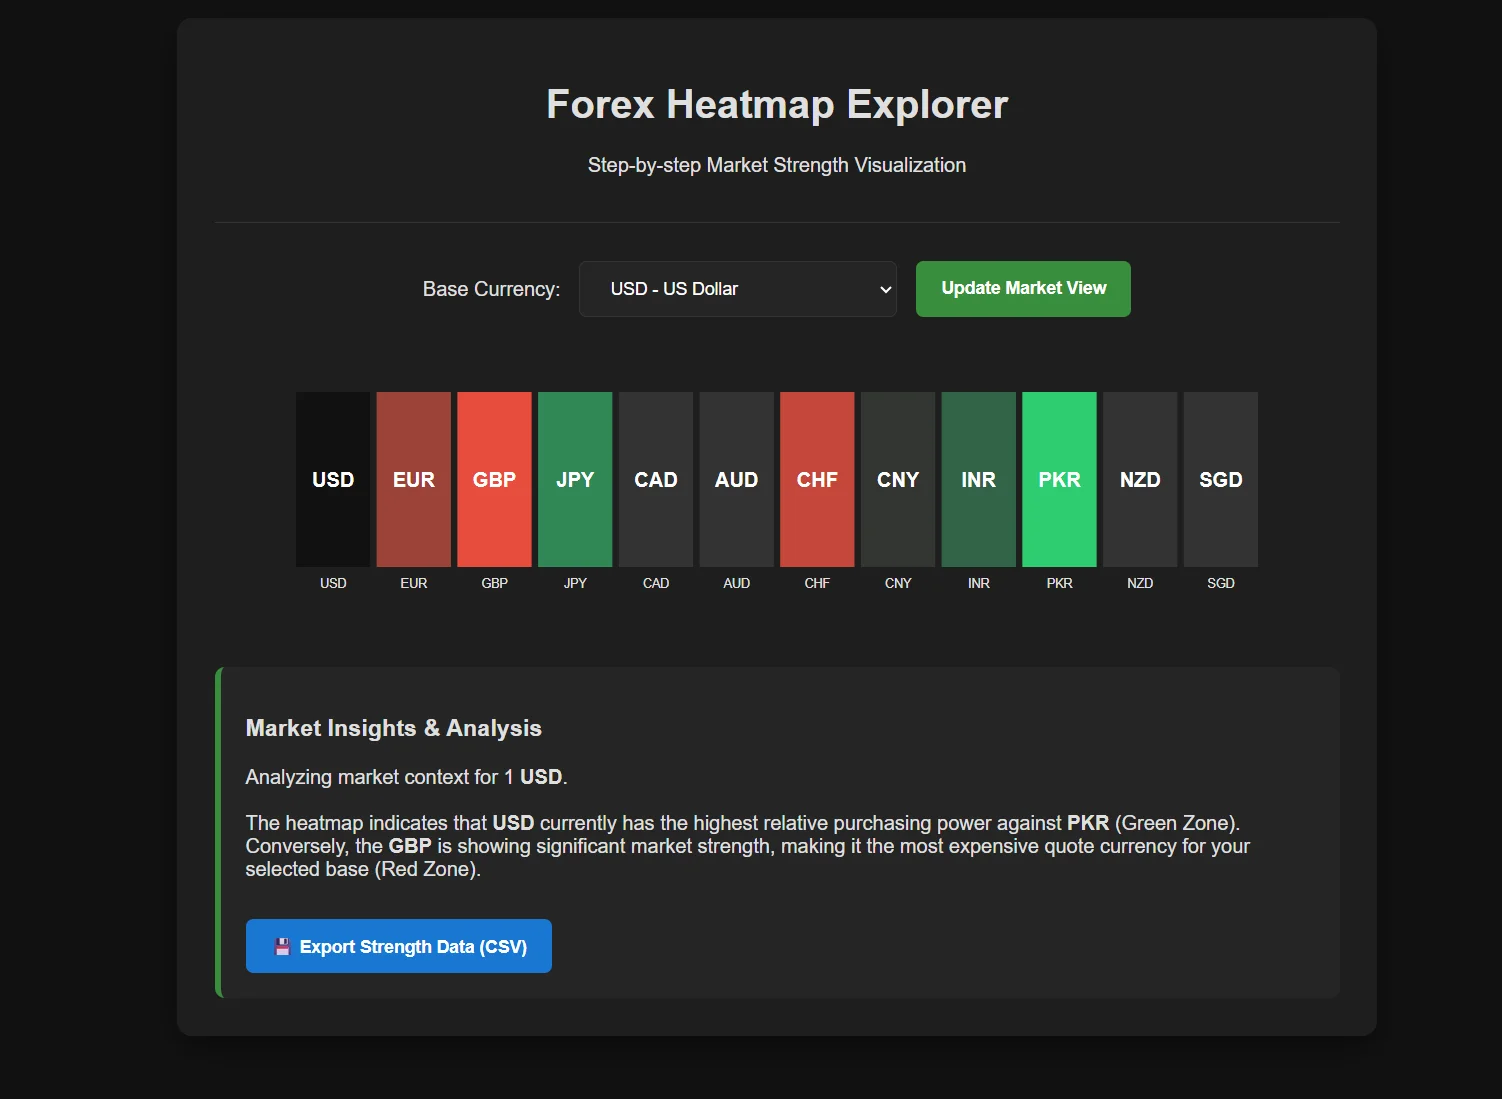
The app follows a simple pipeline: fetch fluctuation data from CurrencyFreaks for the selected base currency, render each currency as a colored cell sized by percent change, and let the user drill into any cell for a plain-language summary or export the whole grid as a CSV.
Green cells mean a currency strengthened against the base; red means it weakened.
Common Mistakes When Building A Forex Heatmap
A few mistakes show up often when building one of these:
-
Swapping base and quote. If a cell shows EUR against USD but you render it as USD against EUR, the colors flip and the whole grid reads backward.
-
Coloring by absolute price instead of percent change. A currency near 1.0 and one near 150 will never look comparable on the same scale - always color by relative movement.
-
Low-contrast color scales. Red-on-red or green-on-green at the edges of the scale makes cells indistinguishable; test the palette at both extremes, not just the midpoint.
Use Cases For A Forex Heatmap Dashboard
Traders use a heatmap to check which pairs have real momentum before entering a trade, instead of scanning through separate charts one at a time.
Analysts use it to compare currency strength across regions at a glance - useful for spotting which currencies are diverging from the group without pulling up individual price charts.
Educators use it to show, visually, why currencies move in relation to each other rather than in isolation - a grid of colors makes that relationship click faster than a table of numbers.
Security And Best Practices For API Usage
Never expose API keys in client-side code where anyone can see them. For a real deployment, store the key in an environment variable on your backend and proxy the fluctuation request through it, the way the demo's closing note describes.
If the fetch fails, don't leave the grid blank or half-rendered - show the last successful data with a stale-data notice, or a clear error message like the demo's "Could not load heatmap data" fallback, instead of a broken screen.
Log failed fetches and slow responses. A silent API outage is easy to miss until a user reports a blank heatmap; a log line at the point of failure catches it first.
Conclusion
A Forex heatmap blends clean data with thoughtful design. CurrencyFreaks gives you clean data, and D3.js makes the patterns obvious. Together, they create a powerful financial heat map.
Instead of switching between separate currency charts, you get every pair's relative strength in one view - which currency is leading, which is lagging, and by how much.
From here, you can extend it: add threshold alerts when a currency moves past a set percentage, let users filter to a subset of pairs, or widen the date range for a longer-term view instead of the 24-hour window used here.
FAQs
What Is A Forex Heatmap Used For?
It puts every currency's relative performance into one grid, so traders can spot which pairs are diverging without checking each one individually.
How Accurate Is A Forex Heatmap Built With Live Data?
It's only as accurate as the underlying feed. CurrencyFreaks' fluctuation endpoint updates close to real time, so the heatmap reflects the same accuracy as the data source.
Can I Build A Forex Heatmap Without D3.js?
Yes - charting libraries like Chart.js or a plain CSS grid can render one too. D3 is worth the extra setup when you need fine-grained control over transitions, scales, or interactivity.
Which Timeframe Works Best For A Forex Heatmap?
A 24-hour window (like this guide's example) suits short-term reads; widen startDate and endDate for a longer-term view if you're planning rather than reacting to intraday moves.
How Many Currency Pairs Should A Forex Heatmap Show?
Enough to be useful without cluttering the grid - 8-10 major pairs, like the CURRENCIES list in this guide, is a reasonable starting point.
Start creating a clear Forex heatmap using CurrencyFreaks today.