Quick answer: batch downloading historical forex data means requesting a full date range in one API call instead of looping one day at a time. With the CurrencyFreaks API, the Time Series endpoint returns daily closing rates for several currency pairs between a start date and an end date. Responses come back as JSON or XML.
Coverage starts on 28 November 1984: daily rates for major fiat currencies run unbroken from that date to today, across 1000+ supported currencies. Pulling the full history takes about 43 requests, one per calendar year, and a short Python script writes each response straight to CSV or Excel.
Backtesting a model or building a dashboard on exchange rates means pulling years of historical data reliably, not one API call at a time. This guide covers batch downloading historical forex data with the CurrencyFreaks API: the endpoints that return a date range, a working Python script that exports CSV and Excel files, and how to fold the result into a data science workflow.
One scope note before you start. CurrencyFreaks returns daily closing rates, not tick data and not 1 minute bars. That fits daily bar backtests, invoicing audits, reporting, and most research datasets. If your model needs intraday granularity, a tick data vendor is the right tool and this guide will not get you there.
The CurrencyFreaks API gives you real-time and historical rates across fiat, crypto, and metals, with a free plan for testing before you commit to a paid tier for larger pulls.
Historical Data Since 1984: Coverage, Granularity, and Formats
Before writing any code, check that the dataset matches the model you plan to build. Three properties decide that: how many currencies are quoted, how far back the series runs, and what granularity each row represents. The table below is the short version.
| Attribute | What the API returns |
|---|---|
| Currencies quoted | 1000+ (fiat, precious metals, cryptocurrencies) |
| Granularity | Daily closing rate, one row per calendar date |
| Earliest date, major fiat | 28 November 1984 |
| Earliest date, newer assets | Each asset's own listing date |
| Single date endpoint | Historical Rates |
| Date range endpoints | Time Series, Fluctuation |
| Response formats | JSON by default, XML with format=xml |
| Base currency | USD on the free plan, any currency on paid plans |
| Export targets | CSV, Excel, Pandas DataFrame |
Coverage is not uniform across all 1000+ codes. A newly listed token has months of history, while USD, EUR, GBP, and JPY have decades. Query https://api.currencyfreaks.com/v2.0/historical-data-limits to get the first available date per currency before you fix your date range, and check the supported currencies list to confirm a code is quoted at all. To sanity check a single date in the browser without writing code, the historical exchange rates tool returns the same daily rate the API serves.
Understanding Historical FX Data
Before pulling data in bulk, it helps to know what you're actually working with. Spot rates show daily closing values for each currency pair. Time series data lets you follow exchange rates across extended date ranges.
Fluctuation metrics tell you how much a price actually moves during a given period. They matter when you run technical analysis on real market behavior. This data brings out volatility, momentum, and small changes hidden inside tick data.
Batch access to historical forex data makes large-scale research practical and efficient. Teams can import data in bulk without delays or manual effort. This makes technical analysis more accurate across long timelines.
Machine learning workflows rely on stable and repeatable inputs. Models need thousands of clean data points to learn patterns. Batch downloads make that possible without slowing analysis or breaking pipelines.
Getting Started with CurrencyFreaks API
Getting started with CurrencyFreaks is simple, even if you are new to forex markets. You just sign up, log in, and grab your API key; it only takes a moment. That one key is all you need to start pulling your Historical Forex Data across different currency pairs for trading strategies.
Sign Up & API Key Generation
Signing up is quick and easy, not time consuming at all. You enter basic details and instantly access your dashboard, which works like a central history center. From there, your personal API key sits clearly at the top.
Which Plan Each Endpoint Needs
CurrencyFreaks gives you a few plan options to choose from. Endpoint access is gated by plan, and that gate decides whether the script in this guide runs at all. The free Developer key returns latest rates and the symbol endpoints only. Historical Rates needs any paid plan. Time Series and Fluctuation, the two endpoints that make batch downloading possible, need the Professional plan or above.
| Endpoint | Minimum plan |
|---|---|
| Latest Rates | Free |
| Supported Currencies, Currency Symbols, Historical Data Limits | Free |
| Historical Rates (single date) | Any paid plan |
| Latest Conversion, Historical Conversion | Any paid plan |
| IP to Currency | Growth |
| Time Series (date range) | Professional |
| Fluctuation | Professional |
Custom base currencies follow the same pattern: the free key is fixed to USD, and paid keys accept any code in the base parameter. Update frequency also rises with the plan, from 24 hours on the free key to 60 seconds at the top tier, which matters for live dashboards but not for a finished historical series. Current limits and prices are on the pricing page.
Where to Find Your API Key
Your API key shows up right inside your dashboard as soon as you sign up. You'll find it under the API Access section, and you can regenerate it whenever you want.
API Security
Security matters when working with currency data and trading strategies. Keep your API key private so your technical indicators stay protected. Do not put it in browser code or anywhere people can see it.
Best Practices
-
Store the key in environment variables
-
Use server-side calls for sensitive workflows
-
Regenerate the key if you suspect exposure
SSL Encryption
All CurrencyFreaks endpoints use SSL encryption. This keeps every request protected from start to finish. It ensures reliable responses for analysis and forward testing.
Avoiding Client-Side Exposure of API Key
Never expose your API key in a browser-side app. Send requests through your backend instead - this keeps access secure and helps avoid misuse.
Response Formats
CurrencyFreaks returns JSON by default and XML when you add format=xml. Neither format needs a parser beyond what ships with Python. Comma separated values are not a response format: you get JSON or XML from the API, then write CSV or Excel yourself in one line of Pandas.
Exported CSV files load into Google Sheets, Excel, or a notebook with no extra step, whether you are tracking three currency pairs or building a full model.
API Endpoints for Historical Data
Three endpoints return historical data, and the one you pick depends on whether you need a single day, a range, or a summary of movement across a range. All three sit on the base URL https://api.currencyfreaks.com/v2.0/ and take apikey as a query parameter.
Historical Rates, one day of closing rates:
https://api.currencyfreaks.com/v2.0/rates/historical?apikey=YOUR_API_KEY&date=2025-03-14&base=USD&symbols=EUR,GBP,JPY
Returns one rate per requested symbol for 14 March 2025.
Time Series, every day in a range:
https://api.currencyfreaks.com/v2.0/timeseries?apikey=YOUR_API_KEY&startDate=2025-01-01&endDate=2025-12-31&base=USD&symbols=EUR,GBP,JPY
Returns a historicalRatesList array with one {date, rates} entry per calendar date, which is the single call that replaces 365 individual requests.
Fluctuation, movement across a range:
https://api.currencyfreaks.com/v2.0/fluctuation?apikey=YOUR_API_KEY&startDate=2025-01-01&endDate=2025-12-31&base=USD&symbols=EUR,GBP
Returns a rateFluctuations object with startRate, endRate, change, and percentChange per symbol, so you skip computing movement from the raw series.
Omitting symbols returns every currency the plan allows, which is the fastest way to build a wide dataset and also the fastest way to spend a request allowance. Full parameter tables, response shapes, and error codes are in the API documentation.
Export Historical Forex Data to CSV and Excel
One Time Series call plus four lines of Pandas produces the two files most workflows actually consume: a CSV for version control and pipelines, and an .xlsx for the person who wants to open it. Install openpyxl alongside Pandas so the Excel writer is available.
pip install requests pandas openpyxl
import requests
import pandas as pd

URL = "https://api.currencyfreaks.com/v2.0/timeseries"
params = {
    "apikey": "YOUR_API_KEY",
    "startDate": "2025-01-01",
    "endDate": "2025-12-31",
    "base": "USD",
    "symbols": "EUR,GBP,JPY",
}

payload = requests.get(URL, params=params, timeout=30).json()

frame = (
    pd.json_normalize(payload["historicalRatesList"])
      .rename(columns=lambda c: c.replace("rates.", ""))
      .set_index("date")
      .astype(float)
      .sort_index()
)

frame.to_csv("usd_daily_rates_2025.csv")
frame.to_excel("usd_daily_rates_2025.xlsx", sheet_name="daily_rates")
print(frame.head())
Writes one row per calendar date and one column per quoted currency to both a CSV and an Excel file, then prints the first five rows so you can eyeball the shape before trusting it.
Two details save rework later. Time Series nests each day as {"date": ..., "rates": {...}} inside historicalRatesList, so json_normalize flattens it to rates.EUR style columns and the rename strips the prefix. Rates arrive as strings, so the .astype(float) cast is not optional if you intend to do arithmetic on the result. And a date range that crosses a gap, a weekend, a market holiday, or a period before an asset was listed, returns fewer rows than the calendar range suggests, so reindex against a business day range and decide explicitly whether to forward fill or leave the gaps visible.
For a chart rather than a file, the same frame plots directly with Matplotlib. If interactive charts are the goal, the Plotly walkthrough for exchange rate data picks up from this dataframe.
CSV Export for Accounting: Transaction Rates and Month-End Rates
Finance teams usually need two files, not one wide rate table. The first converts each foreign currency invoice at the rate on its own transaction date. The second lists month-end closing rates for revaluing open balances. Both come from the same Time Series call.
Say invoices.csv has four columns: invoice_id, date, currency, and amount.
import os
import pandas as pd
import requests

tx = pd.read_csv("invoices.csv", parse_dates=["date"])

params = {
    "apikey": os.environ["CURRENCYFREAKS_API_KEY"],
    "startDate": tx["date"].min().strftime("%Y-%m-%d"),
    "endDate": tx["date"].max().strftime("%Y-%m-%d"),
    "base": "USD",
    "symbols": ",".join(sorted(tx["currency"].unique())),
}
rows = requests.get(
    "https://api.currencyfreaks.com/v2.0/timeseries", params=params, timeout=60
).json()["historicalRatesList"]

wide = (
    pd.json_normalize(rows)
      .rename(columns=lambda c: c.replace("rates.", ""))
      .assign(date=lambda d: pd.to_datetime(d["date"]))
      .set_index("date")
      .astype(float)
)

# File 1: every invoice converted at its own day's rate
rates = wide.reset_index().melt(id_vars="date", var_name="currency", value_name="usd_rate")
ledger = tx.merge(rates, on=["date", "currency"], how="left")
ledger["amount_usd"] = (ledger["amount"] / ledger["usd_rate"]).round(2)
ledger.to_csv("invoices_usd.csv", index=False, date_format="%Y-%m-%d", encoding="utf-8-sig")

# File 2: last rate of each month, for revaluation
month_end = wide.resample("ME").last()
month_end.to_csv("usd_month_end_rates.csv", date_format="%Y-%m-%d", encoding="utf-8-sig")
A few choices in that script are deliberate:
- Divide, don't multiply. With
base=USD, each rate is units of foreign currency per 1 US dollar, so a EUR 920 invoice at 0.92 is USD 1,000.00. - The rate column stays in the output. An auditor asking why invoice 1042 booked at USD 1,000.00 can see the 0.92 next to it without rerunning anything.
utf-8-sigencoding. Excel on Windows reads the byte order mark and opens currency names and symbols correctly. Plain UTF-8 often shows garbled characters on a double click."ME"means month end in Pandas 2.2 and later. On older versions use"M".
Any amount_usd cell left blank after the merge points to a currency code the API didn't recognize or a date outside the range, so filter for nulls before you post the file. One more check before this goes near the general ledger: your accounting policy should name the rate source. If it requires a central bank fixing, use this file for reconciliation and management reporting, not as the booked rate.
Bulk Historical Fetch: Multi-Year Ranges, Looping, and Quota Limits
The export above works for a year. For the full series back to 28 November 1984, split the pull into yearly windows and loop over them. The API has no pagination parameter: you page through history by moving startDate and endDate forward, and each window costs one request.
Why split at all when one call can name any start and end date? Three reasons:
- A failed call loses one year, not 42 years of progress.
- Each response stays small enough to inspect by eye when something looks wrong.
- Writing after every window lets an interrupted job resume where it stopped.
The documentation lists no daily or hourly rate limit. The only hard limit is the monthly or yearly request quota of your plan, and a 429 response means that quota is used up. Retrying a 429 is pointless, since every retry hits the same wall. Timeouts and 5xx errors are different: those are transient, and a short exponential backoff gets past them.
import os
import time
from datetime import date

import pandas as pd
import requests

URL = "https://api.currencyfreaks.com/v2.0/timeseries"
API_KEY = os.environ["CURRENCYFREAKS_API_KEY"]
SYMBOLS = ["EUR", "GBP", "JPY", "CHF"]
OUT = "usd_daily_rates_full.csv"


class QuotaExhausted(Exception):
    pass


def year_windows(start, end):
    """Yield one (startDate, endDate) pair per calendar year."""
    for year in range(start.year, end.year + 1):
        lo = max(start, date(year, 1, 1))
        hi = min(end, date(year, 12, 31))
        yield lo.isoformat(), hi.isoformat()


def fetch_window(start, end, max_attempts=4):
    params = {"apikey": API_KEY, "startDate": start, "endDate": end,
              "base": "USD", "symbols": ",".join(SYMBOLS)}
    for attempt in range(max_attempts):
        try:
            resp = requests.get(URL, params=params, timeout=60)
        except (requests.ConnectionError, requests.Timeout):
            resp = None
        if resp is not None:
            if resp.status_code == 200:
                return resp.json()["historicalRatesList"]
            if resp.status_code == 429:
                raise QuotaExhausted(resp.text)
            if resp.status_code < 500:
                resp.raise_for_status()  # 400, 401, 402, 404: fix the request
        if attempt < max_attempts - 1:
            time.sleep(2 ** attempt)  # 1s, 2s, 4s
    raise RuntimeError(f"{start} to {end} failed after {max_attempts} attempts")


done_years = set()
if os.path.exists(OUT):
    done_years = set(pd.read_csv(OUT, usecols=["date"])["date"].str[:4])

for start, end in year_windows(date(1984, 11, 28), date.today()):
    if start[:4] in done_years:
        continue
    rows = fetch_window(start, end)
    frame = (
        pd.json_normalize(rows)
          .rename(columns=lambda c: c.replace("rates.", ""))
          .set_index("date")
          .reindex(columns=SYMBOLS)
          .astype(float)
    )
    frame.to_csv(OUT, mode="a", header=not os.path.exists(OUT))
    print(f"{start} to {end}: {len(frame)} rows")
Run it once and it writes 43 yearly windows, from 1984 to 2026, into one CSV. Kill it halfway and run it again: it reads the years already on disk and skips them, so a rerun spends requests only on what's missing.
The .reindex(columns=SYMBOLS) line matters more than it looks. Appending chunks to one CSV only works if every chunk has the same columns in the same order. A currency with no quote in an early year would otherwise drop out of that chunk and shift every column after it. Check the first available date per code with the Historical Data Limits endpoint before choosing SYMBOLS, or expect empty cells for the early years.
Before a large pull, count requests against your quota. Four symbols over the full history costs 43 requests. Dropping symbols to fetch every currency still costs 43, but each response gets much larger, so raise the timeout. Running the loop daily to keep the file current is the expensive habit: for top-ups, request only the last few days, append them, and leave the rebuild for when you actually change SYMBOLS. The skip-by-year check treats the current year as done once any of it is on disk, so top-ups need that separate short-range call.
When a window fails for good, log the window, the status code, and the response body. "2003-01-01 to 2003-12-31, 401, Provided API key is inactive" tells you what to fix. A bare stack trace doesn't.
Batch Download Workflow
Before you run this code, you must have Python installed on your system. You can download the latest version of Python from: https://www.python.org/downloads/
Next, you should create a folder in your system to keep the Python file.
Create a Python file and name it "forex_analysis"
Next, open a terminal and activate the virtual environment.
For this code to run, you need these Python libraries:
-
requests for making API calls
-
pandas for data handling and manipulation
-
matplotlib for drawing charts
-
mplfinance for candlestick charts
You can install them using pip with this single command:
pip install requests pandas matplotlib mplfinance
-
This code fetches currency exchange data from CurrencyFreaks API.
-
It lets the user choose dates, currencies, and the type of data endpoint.
-
Then it either saves the data as a CSV or draws a chart.
-
Charts can be line, bar, or candlestick, depending on user choice.
Here is the complete code with output screenshots:
import requests
import pandas as pd
import matplotlib
matplotlib.use("Agg")  # Avoid Tkinter GUI issues
import matplotlib.pyplot as plt
import mplfinance as mpf
import os

# ---------- CONFIG ----------
API_KEY = "add-your-api-key"  # <-- Your CurrencyFreaks API key
BASE_URL = "https://api.currencyfreaks.com/v2.0"
# ----------------------------

# Fetch supported currency symbols
def get_supported_currencies():
    url = f"{BASE_URL}/currency-symbols"
    response = requests.get(url)
    data = response.json()
    return data.get("currencySymbols", {})

currencies = get_supported_currencies()
print("Supported currencies (first 50 shown for brevity):")
for code, name in list(currencies.items())[:50]:
    print(f"{code} - {name}")

# ---------- USER INPUT ----------
base_currency = input("Enter base currency code (e.g., USD): ").upper()
symbol_currency = input("Enter symbol currency code (e.g., EUR): ").upper()
start_date = input("Enter start date (YYYY-MM-DD): ")
end_date = input("Enter end date (YYYY-MM-DD): ")

print("\nEndpoints:\n1 - Historical\n2 - Time Series\n3 - Fluctuation")
endpoint_choice = input("Choose endpoint (1/2/3): ")

print("\nOutput options:\n1 - Download CSV\n2 - Draw Chart")
output_choice = input("Choose output (1/2): ")

chart_type = None
if output_choice == "2":
    print("\nChart options:\n1 - Line Chart\n2 - Bar Chart\n3 - Candlestick Chart")
    chart_type = input("Choose chart type: ")

# ---------- API CALL ----------
def fetch_data():
    if endpoint_choice == "1":  # Historical
        dates = pd.date_range(start=start_date, end=end_date)
        all_data = []
        for d in dates:
            url = f"{BASE_URL}/rates/historical?apikey={API_KEY}&date={d.strftime('%Y-%m-%d')}&base={base_currency}&symbols={symbol_currency}"
            r = requests.get(url).json()
            rate = r.get("rates", {}).get(symbol_currency)
            all_data.append({"Date": d.strftime("%Y-%m-%d"), "Rate": float(rate) if rate else None})
        return pd.DataFrame(all_data)

    elif endpoint_choice == "2":  # Time Series
        url = f"{BASE_URL}/timeseries?apikey={API_KEY}&startDate={start_date}&endDate={end_date}&base={base_currency}&symbols={symbol_currency}"
        r = requests.get(url).json()
        data_list = r.get("historicalRatesList", [])
        all_data = [{"Date": d["date"], "Rate": float(d["rates"].get(symbol_currency, 0))} for d in data_list]
        return pd.DataFrame(all_data)

    elif endpoint_choice == "3":  # Fluctuation
        url = f"{BASE_URL}/fluctuation?apikey={API_KEY}&startDate={start_date}&endDate={end_date}&base={base_currency}&symbols={symbol_currency}"
        r = requests.get(url).json()
        rate_data = r.get("rateFluctuations", {}).get(symbol_currency, {})
        all_data = [{"Date": start_date,
                     "StartRate": float(rate_data.get("startRate", 0)),
                     "EndRate": float(rate_data.get("endRate", 0)),
                     "Change": float(rate_data.get("change", 0)),
                     "PercentChange": float(rate_data.get("percentChange", 0))}]
        return pd.DataFrame(all_data)

df = fetch_data()

# ---------- OUTPUT ----------
# CSV download
if output_choice == "1":
    filename = f"{base_currency}_{symbol_currency}_{start_date}_{end_date}.csv"
    df.to_csv(filename, index=False)
    print(f"CSV saved as {filename}")

# Chart output
elif output_choice == "2":
    if chart_type in ["1", "2"]:
        plt.figure(figsize=(12,6))

        # Handle tiny numbers automatically
        if endpoint_choice != "3" and df["Rate"].max() < 1:
            # Convert to reciprocal if rates are very small
            df["DisplayRate"] = 1 / df["Rate"]
            ylabel = f"{symbol_currency} per {base_currency}"
        else:
            df["DisplayRate"] = df.get("Rate", df.get("EndRate", df.get("Close", 0)))
            ylabel = "Rate"

        x = pd.to_datetime(df["Date"])
        y = df["DisplayRate"]

        if endpoint_choice == "3":  # Fluctuation chart
            plt.bar(x, y, color='orange', alpha=0.7)
            plt.title(f"{symbol_currency} Fluctuation ({base_currency})")
        else:
            if chart_type == "1":  # Line
                plt.plot(x, y, marker='o', color='blue', linewidth=2)
            else:  # Bar
                plt.bar(x, y, color='skyblue', alpha=0.7)
            plt.title(f"{base_currency} vs {symbol_currency}")

        plt.ylabel(ylabel)
        plt.xlabel("Date")
        plt.grid(True, linestyle='--', alpha=0.5)
        plt.xticks(rotation=45)
        plt.tight_layout()
        filename = f"{base_currency}_{symbol_currency}_{start_date}_{end_date}.png"
        plt.savefig(filename)
        print(f"Chart saved as {filename}")

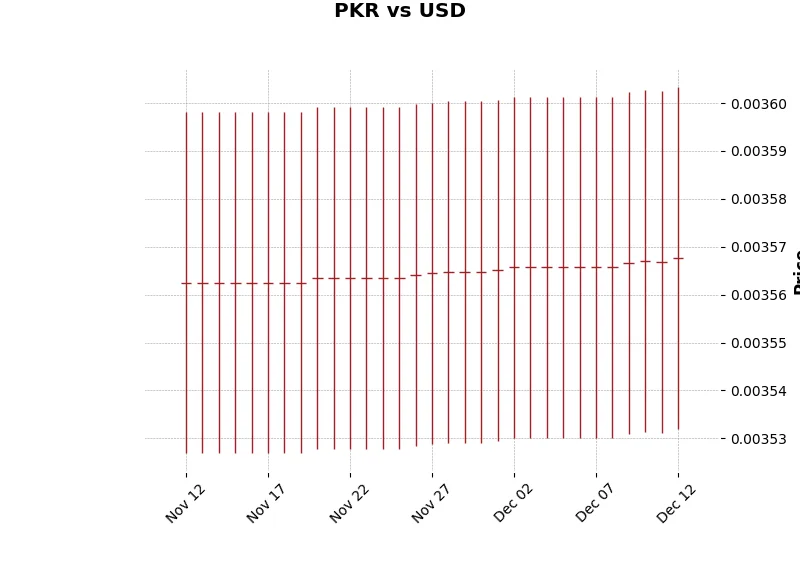
    elif chart_type == "3":  # Candlestick chart
        if endpoint_choice != "2":
            print("Candlestick chart only works for Time Series endpoint.")
        else:
            df_candle = df.copy()
            df_candle["Open"] = df_candle["Rate"]
            df_candle["Close"] = df_candle["Rate"]
            df_candle["High"] = df_candle["Rate"] * 1.01
            df_candle["Low"] = df_candle["Rate"] * 0.99
            df_candle.index = pd.to_datetime(df_candle["Date"])
            df_candle = df_candle[["Open","High","Low","Close"]]
            filename = f"{base_currency}_{symbol_currency}_{start_date}_{end_date}_candlestick.png"
            mpf.plot(df_candle, type='candle', style='charles', title=f"{base_currency} vs {symbol_currency}", volume=False, savefig=filename)
            print(f"Candlestick chart saved as {filename}")
Next, run the code using the following command:
python forex_analysis.py
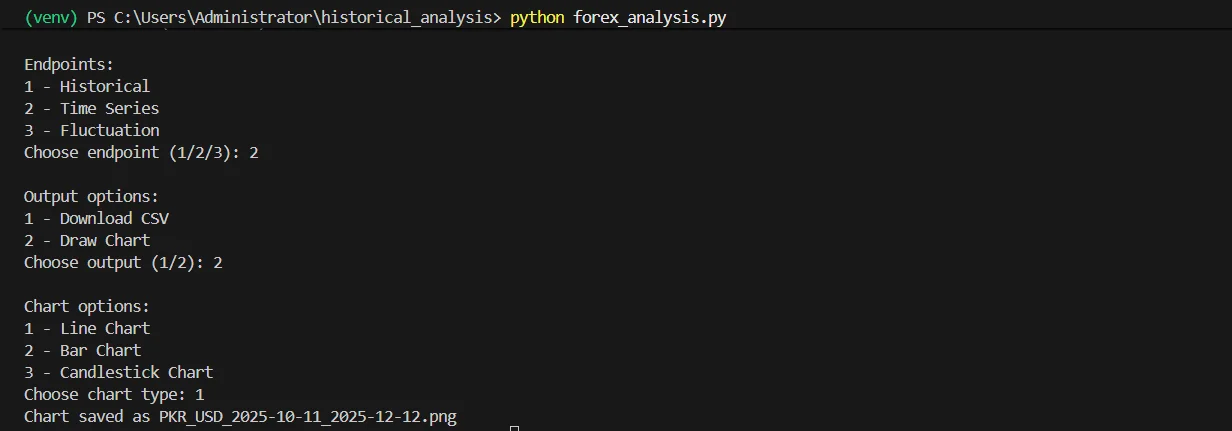
When you run the script, it first fetches a list of supported currencies from the CurrencyFreaks API. You can see the first 50 currencies printed, like AGLD (Adventure Gold), FJD (Fiji Dollar), ETHFI (ether.fi), and many more
Next, the program asks the user to input a base currency (the currency you have, e.g., USD) and a symbol currency (the currency you want to compare against, e.g., PKR). You also provide a start date and end date for the data
Then, the script asks you to choose an endpoint type
-
Historical fetches daily rates for each date in your range
-
Time Series retrieves rates in a ready-made series
-
Fluctuation calculates changes between start and end dates
After that, you choose an output option
-
CSV download saves the data as a CSV file
-
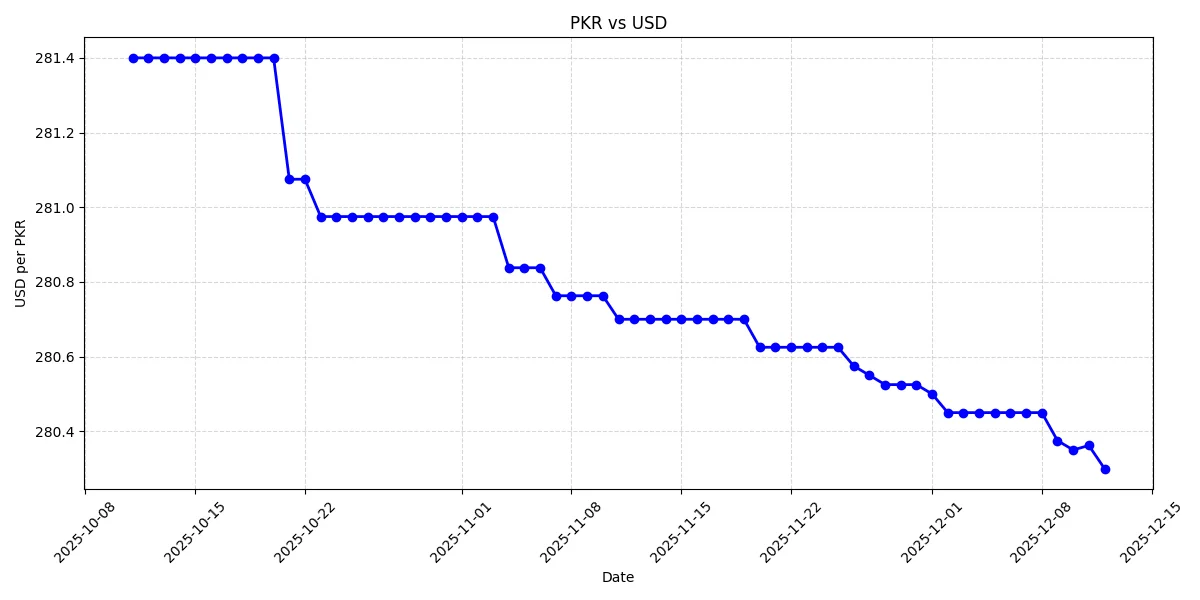
Draw chart plots a line, bar, or candlestick chart
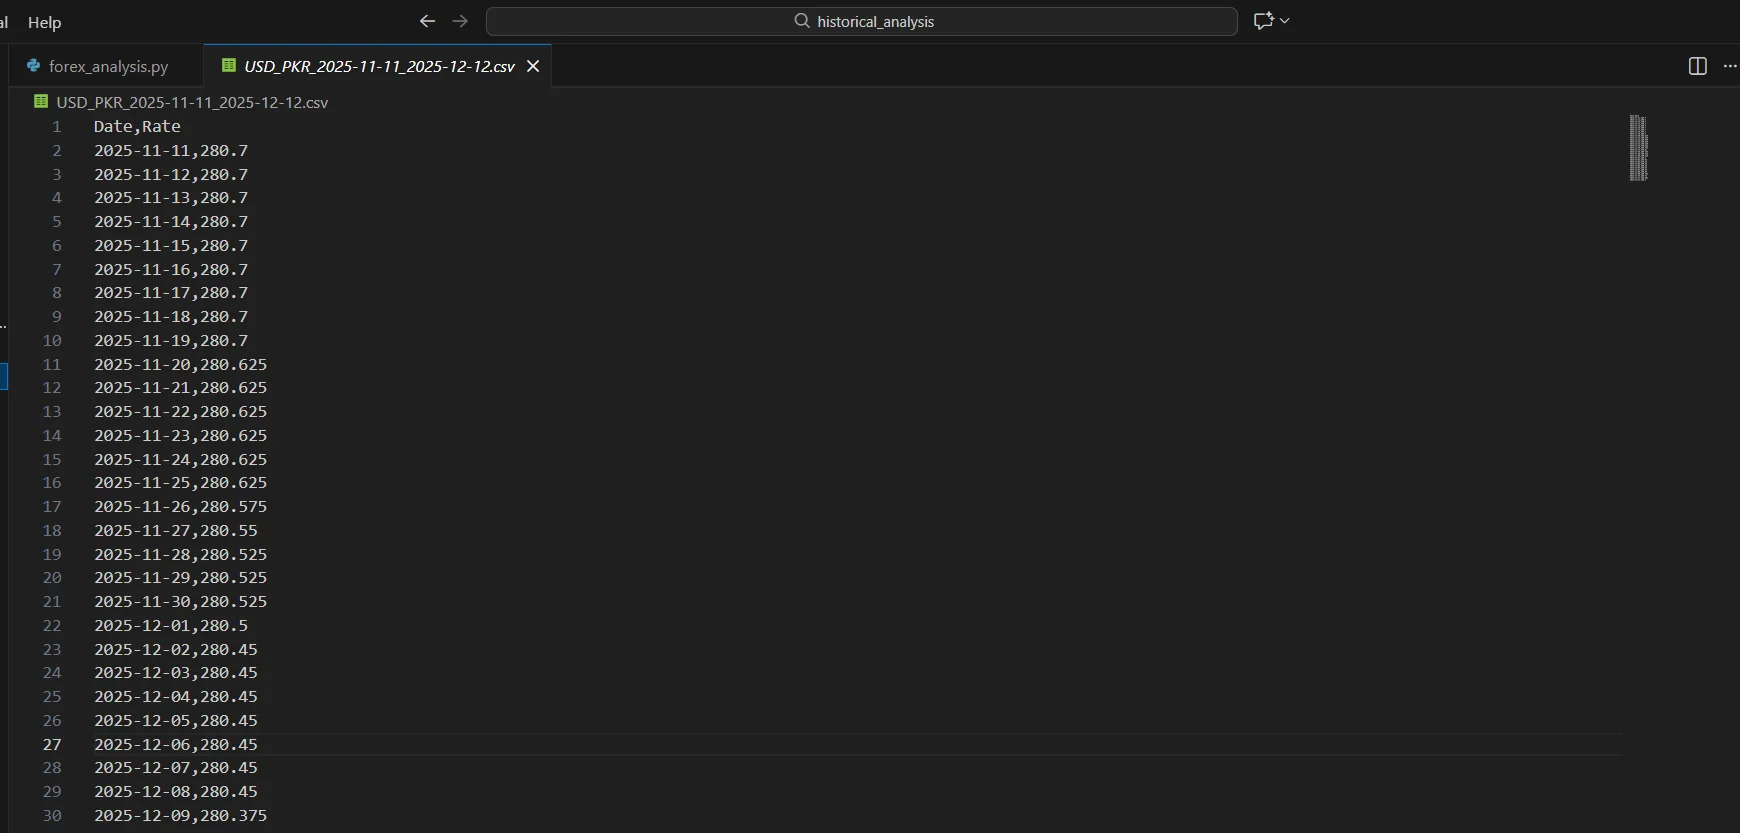
Now you have a ready-to-use CSV file with all the historical exchange rates, which you can analyze in Excel, Python, or any data tool.
Integrating FX Data into Data Science Workflows
Historical Forex Data needs little prep once it lands in Pandas or NumPy. You load the file, check the columns, and start shaping it the way you need. Nothing fancy, just clean data you can work with right away.
A CSV export slides straight into a dataframe with no extra parsing. JSON keeps things flexible if you're feeding the data into other scripts rather than a notebook. Test the request shape against the latest rates endpoint on a free key first, then switch to a paid key for the historical range.
Merging FX data with market datasets often reveals patterns you don’t notice at first glance. You might compare currency moves with stocks or commodities.
You can also line them up with global indicators stored in different formats. Once the pieces line up, the relationships start to make sense.
These merged sets help with real analysis. You can map trends tied to the Japanese yen or spot shifts around the Turkish lira. Some teams train models to test simple forecasts.
Others explore legacy signals like the Croatian kuna. This workflow grows naturally as your project evolves.

Advanced Use Cases
Currency conversion using historical rates
When you reconcile past transactions, you need the rate that applied on the exact day, not today's. The Historical Conversion endpoint takes from, to, amount, and date, so a refund booked on 14 March 2025 settles at that day's rate. For a single check without writing code, the historical currency converter returns the same daily rate in the browser. It also helps when you’re reviewing older reports or cross-checking results against historical data from other sources like OANDA.
Fluctuation analysis for risk modeling
Some projects need a measure of how fast the market moved, not just where it closed. The Fluctuation endpoint returns startRate, endRate, change, and percentChange for each symbol across a date range, which is enough to rank pairs by realized movement without pulling the full series. Daily granularity puts a floor on what you can detect: an intraday spike that reverses before the close will not appear in this dataset.
Automating daily updates for dashboards
Most teams don’t want to refresh charts by hand every morning. Running the same Python script above on a schedule keeps your dashboards updated automatically, so your trends stay current and your alerts stay accurate.
Key Takeaways
- One Time Series call replaces a loop of single date requests and returns an identical series on every rerun, which is what makes a backtest reproducible.
- Coverage is 1000+ currencies with daily closing rates from 28 November 1984 for major fiat, and from each asset's listing date for everything newer.
- Time Series and Fluctuation require the Professional plan. Historical Rates requires any paid plan. Plan the pull before writing the script.
- For the full series since 1984, loop over yearly windows: 43 requests, resumable, and a 429 means the plan quota is spent, not that you should retry.
- Cast rates to float and reindex against a business day range, because the API returns strings and skips dates with no quote.
- Write the range to CSV once and version the file with the model. Refetching the same range on every run wastes the request allowance and invites drift.
Conclusion
Batch downloading historical forex data replaces hundreds of single date calls with one request per range. The practical payoff is reproducibility: the same start date, end date, and symbol list return the same series in a notebook run today and in the same run next quarter.
Size the plan against the pull before you write the script. Time Series and Fluctuation need the Professional plan, Historical Rates needs any paid plan, and the free Developer key covers latest rates only. Create an API key and run the script above against a two week range first, then scale the date range once the output shape is what you expected.
FAQs
Can I Download Historical FX Data For All Currencies At Once?
Yes. The Time Series endpoint returns every currency your plan allows when you leave the symbols parameter off, and a named subset when you include it. Omitting symbols produces a much larger response and consumes the same single request, so it is the efficient way to build a wide dataset. Time Series requires the Professional plan.
What Date Range Is available for historical data?
Daily rates for major fiat currencies such as USD, EUR, GBP, and JPY start on 28 November 1984. Newer assets, including most cryptocurrencies and recently redenominated currencies, start on their own listing date instead. Call the Historical Data Limits endpoint to get the exact first available date for any currency code before fixing a date range.
How Do I Handle API Rate Limits During Batch Downloads?
CurrencyFreaks has no daily or hourly rate limit, only the request quota of your plan. A 429 response means that quota is used up, so stop the job instead of retrying. Back off exponentially only on timeouts and 5xx errors, and cap retries at three or four attempts. Splitting a multi year pull into yearly Time Series calls keeps each response small and each failure cheap to retry.
Can I Use A Custom Base Currency For Historical Rates?
Yes, on any paid plan. Pass the ISO 4217 code in the base parameter, for example base=EUR, and every rate in the response is quoted against that currency. The free Developer key is fixed to USD, so rebase in Pandas by dividing the USD series if you are still testing on a free key.
What Formats Can I Receive The Data In?
The API returns JSON by default and XML when you add format=xml. CSV and Excel are not response formats. You produce them locally: load the JSON into a Pandas dataframe, then call to_csv or to_excel in one line, which is what the export script in this guide does.
How Do I Convert Historical FX Rates For Specific Amounts?
Call the Historical Conversion endpoint with from, to, amount, and date. It applies that date's closing rate and returns the converted amount, so you do not multiply by hand and risk using the wrong day. Historical Conversion is available on any paid plan.
Start working with clean historical forex data today using CurrencyFreaks. Pull reliable data and build smarter models with less effort.