
Last updated: 21 August 2026
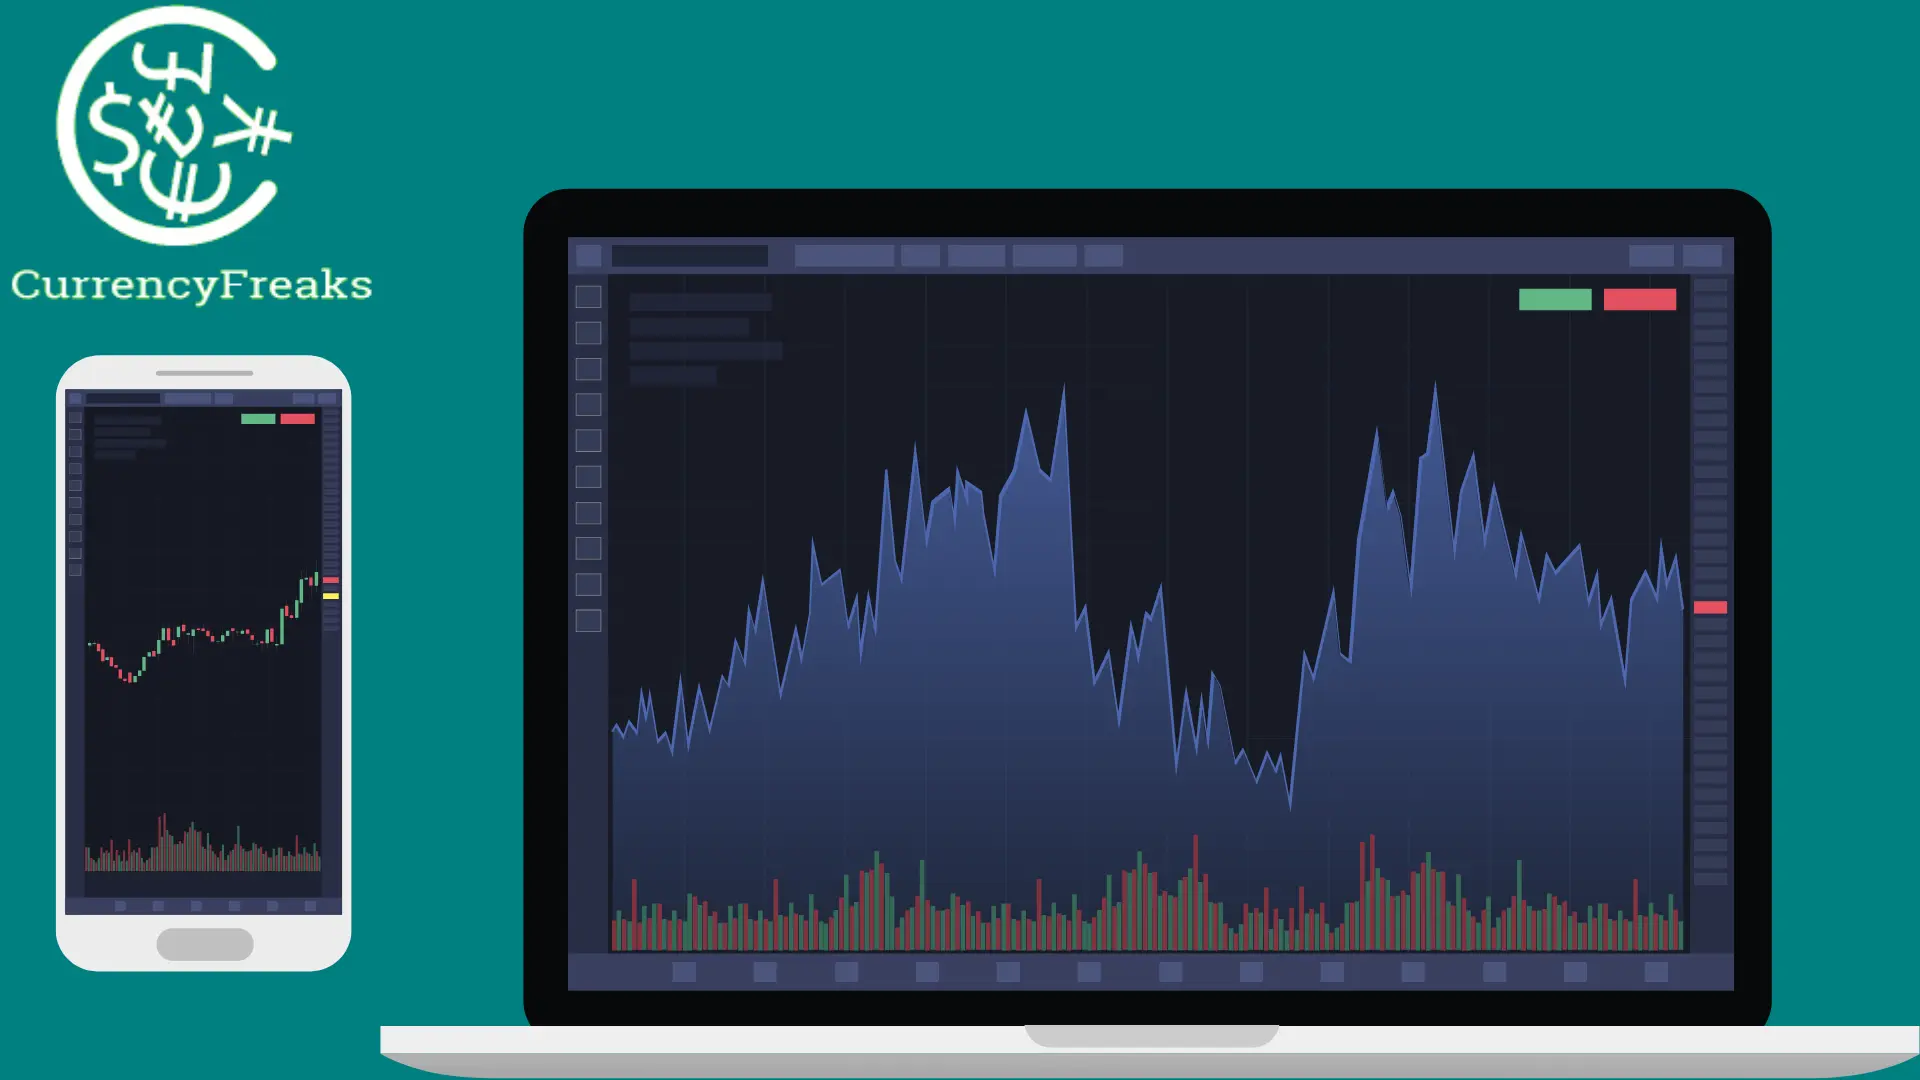
A forex dashboard is a single screen showing live currency rates, past trends, and charts, so a trader can read the market at a glance. This tutorial builds one with Python, Flask, and the CurrencyFreaks API, which supplies the live rates, historical rates, and time series data the dashboard needs.
Can We Build a Forex Dashboard with Real-Time Currency API?
It is easier to create a forex dashboard using the CurrencyFreaks API. Let's show you how.
Building the Flask Dashboard
The dashboard has two files: app.py (the Flask backend that calls CurrencyFreaks) and templates/index.html (the browser UI with a live rate table and historical chart).
forex-dashboard/
  app.py
  templates/
    index.html
Step 1: Install Dependencies
pip install flask requests
Step 2: Get Your API Key
Create a free account at CurrencyFreaks and copy your API key from the dashboard.
Step 3: Create app.py
from flask import Flask, render_template, jsonify, request
import requests

app = Flask(__name__)

API_KEY = 'YOUR_API_KEY'
BASE_URL = 'https://api.currencyfreaks.com/v2.0'

@app.route('/')
def index():
    return render_template('index.html')

@app.route('/api/rates')
def get_rates():
    base = request.args.get('base', 'USD')
    try:
        r = requests.get(f'{BASE_URL}/rates/latest', params={
            'apikey': API_KEY,
            'base': base,
            'symbols': 'EUR,GBP,JPY,CAD,AUD,CHF'
        }, timeout=5)
        r.raise_for_status()
        return jsonify(r.json())
    except requests.exceptions.HTTPError as e:
        return jsonify({'error': f'API error: {e.response.status_code}'}), e.response.status_code
    except Exception as e:
        return jsonify({'error': str(e)}), 500

@app.route('/api/timeseries')
def get_timeseries():
    base = request.args.get('base', 'USD')
    symbol = request.args.get('symbol', 'EUR')
    start_date = request.args.get('startDate')
    end_date = request.args.get('endDate')
    try:
        r = requests.get(f'{BASE_URL}/timeseries', params={
            'apikey': API_KEY,
            'base': base,
            'symbols': symbol,
            'startDate': start_date,
            'endDate': end_date
        }, timeout=5)
        r.raise_for_status()
        return jsonify(r.json())
    except requests.exceptions.HTTPError as e:
        return jsonify({'error': f'API error: {e.response.status_code}'}), e.response.status_code
    except Exception as e:
        return jsonify({'error': str(e)}), 500

if __name__ == '__main__':
    app.run(debug=True)
The /api/rates route fetches live rates for the selected base currency. The /api/timeseries route fetches daily rates between two dates for plotting the chart.
Step 4: Create templates/index.html
<!DOCTYPE html>
<html lang="en">
<head>
  <meta charset="UTF-8">
  <meta name="viewport" content="width=device-width, initial-scale=1.0">
  <title>Forex Dashboard</title>
  <script src="https://cdn.jsdelivr.net/npm/[email protected]/dist/chart.umd.min.js"></script>
  <style>
    * { box-sizing: border-box; }
    body { font-family: Arial, sans-serif; margin: 0; padding: 20px; background: #f5f5f5; color: #333; }
    h1 { margin-bottom: 20px; }
    h2 { margin-top: 0; font-size: 1.1rem; color: #555; }
    .card { background: white; border-radius: 8px; padding: 24px; margin-bottom: 20px; box-shadow: 0 1px 4px rgba(0,0,0,0.1); }
    .controls { display: flex; flex-wrap: wrap; gap: 10px; align-items: center; margin-bottom: 16px; }
    select, input { padding: 8px 10px; border: 1px solid #ddd; border-radius: 4px; font-size: 0.9rem; }
    button { padding: 8px 16px; background: teal; color: white; border: none; border-radius: 4px; cursor: pointer; font-size: 0.9rem; }
    button:hover { background: #006666; }
    table { width: 100%; border-collapse: collapse; }
    th, td { text-align: left; padding: 10px 12px; border-bottom: 1px solid #f0f0f0; font-size: 0.9rem; }
    th { background: #fafafa; font-weight: 600; color: #555; }
    #status { color: #c0392b; font-size: 0.85rem; margin-top: 8px; min-height: 18px; }
    #rateDate { color: #999; font-size: 0.8rem; margin: 0 0 12px; }
  </style>
</head>
<body>
  <h1>Forex Dashboard</h1>

  <div class="card">
    <h2>Live Rates</h2>
    <div class="controls">
      <label>Base:
        <select id="baseCurrency">
          <option value="USD">USD</option>
          <option value="EUR">EUR</option>
          <option value="GBP">GBP</option>
          <option value="JPY">JPY</option>
          <option value="CAD">CAD</option>
        </select>
      </label>
      <button onclick="loadRates()">Refresh</button>
    </div>
    <p id="rateDate"></p>
    <table>
      <thead><tr><th>Currency</th><th>Rate</th></tr></thead>
      <tbody id="ratesBody"></tbody>
    </table>
    <p id="status"></p>
  </div>

  <div class="card">
    <h2>Historical Chart</h2>
    <div class="controls">
      <label>Symbol: <input id="symbol" value="EUR" style="width:70px"></label>
      <label>From: <input type="date" id="startDate"></label>
      <label>To: <input type="date" id="endDate"></label>
      <button onclick="loadChart()">Plot</button>
    </div>
    <canvas id="ratesChart"></canvas>
  </div>

  <script>
    let chartInstance = null;

    const today = new Date().toISOString().split('T')[0];
    const thirtyDaysAgo = new Date(Date.now() - 30 * 864e5).toISOString().split('T')[0];
    document.getElementById('endDate').value = today;
    document.getElementById('startDate').value = thirtyDaysAgo;

    async function loadRates() {
      const base = document.getElementById('baseCurrency').value;
      const status = document.getElementById('status');
      status.textContent = '';
      try {
        const res = await fetch(`/api/rates?base=${base}`);
        const data = await res.json();
        if (data.error) { status.textContent = data.error; return; }
        document.getElementById('rateDate').textContent = `Last updated: ${data.date}`;
        document.getElementById('ratesBody').innerHTML = Object.entries(data.rates)
          .map(([code, rate]) => `<tr><td>${code}</td><td>${parseFloat(rate).toFixed(4)}</td></tr>`)
          .join('');
      } catch {
        status.textContent = 'Could not load rates. Check your connection.';
      }
    }

    async function loadChart() {
      const base = document.getElementById('baseCurrency').value;
      const symbol = document.getElementById('symbol').value.toUpperCase();
      const startDate = document.getElementById('startDate').value;
      const endDate = document.getElementById('endDate').value;
      const status = document.getElementById('status');
      status.textContent = '';
      try {
        const res = await fetch(`/api/timeseries?base=${base}&symbol=${symbol}&startDate=${startDate}&endDate=${endDate}`);
        const data = await res.json();
        if (data.error) { status.textContent = data.error; return; }
        const entries = data.historicalRatesList || [];
        if (!entries.length) { status.textContent = 'No data found for this date range.'; return; }
        const labels = entries.map(e => e.date);
        const rates = entries.map(e => parseFloat(e.rates[symbol]));
        if (chartInstance) chartInstance.destroy();
        chartInstance = new Chart(document.getElementById('ratesChart'), {
          type: 'line',
          data: {
            labels,
            datasets: [{
              label: `${base}/${symbol}`,
              data: rates,
              borderColor: 'teal',
              backgroundColor: 'rgba(0,128,128,0.08)',
              tension: 0.3,
              pointRadius: 3
            }]
          },
          options: { responsive: true, plugins: { legend: { position: 'top' } } }
        });
      } catch {
        status.textContent = 'Could not load chart data.';
      }
    }

    loadRates();
  </script>
</body>
</html>
Step 5: Run the Dashboard
python app.py
Open your browser at http://127.0.0.1:5000. The dashboard loads live rates on startup and lets you switch base currencies and plot historical charts for any date range.
What It Does
- Live rate table -- fetches the latest rates for six major currencies against your selected base, refreshed on demand.
- Historical chart -- plots daily rates between any two dates using the CurrencyFreaks timeseries endpoint and Chart.js.
- Error handling -- API errors (401 invalid key, 429 rate limit) surface as readable messages in the UI instead of crashing the page.
Conclusion
This Flask dashboard replaces the need for a desktop app. It runs in any browser, is straightforward to deploy to a production server (Heroku, Railway, or any VPS with Python), and calls the CurrencyFreaks v2.0 API directly from the backend so your API key stays server-side. Start with the free currency converter API -- no credit card required.
FAQs
What Python packages do I need?
Install Flask and requests: pip install flask requests. Chart.js is loaded from a CDN in the HTML, so no additional Python packages are needed for the chart.
How do I deploy this to a production server?
Set debug=False in app.run(), move your API key to an environment variable (os.environ.get('CF_API_KEY')), and deploy with Gunicorn behind Nginx or use a platform like Railway or Render. The app has no database, so deployment is straightforward.
How many API calls does the dashboard use?
One call to /api/rates each time the user clicks Refresh, and one call to /api/timeseries each time they click Plot. During development, save a sample JSON response to a file and return it from a test route so you do not burn free plan calls while building.
Can I add more currencies to the rate table?
Yes. In app.py, update the symbols parameter in the /api/rates route to include any currency codes you need, for example symbols=EUR,GBP,JPY,CAD,AUD,CHF,INR,PKR,SGD. The full list of supported codes is in the CurrencyFreaks documentation.
Sign Up for free at CurrencyFreaks and start building your forex dashboard today.