
Analyze Currency Volatility With A Foreign Exchange Rates API: Fluctuation Endpoint Guide
Currency volatility looks confusing at first, but it doesn’t have to feel overwhelming. Rates move for many reasons, and those swings often tell you something useful. When the exchange rate data is clean, everything becomes easier to read and easier to use.
CurrencyFreaks offers a simple and reliable way to explore volatility trends without digging through messy spreadsheets. You get a clean foreign exchange rates api that gives you numbers you can trust. This helps analysts, developers, and anyone who works with money across borders make sense of changes at a glance.
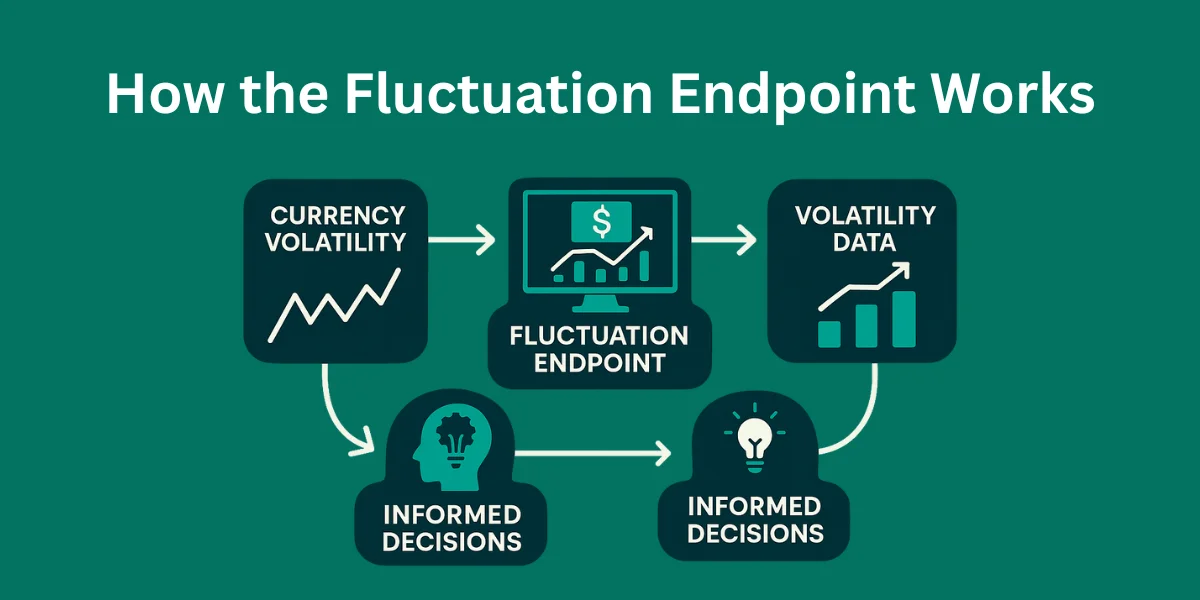
The focus of this guide is the Fluctuation endpoint. It shows how much a currency has moved between two dates. It turns a complicated topic into something clear and very practical.
What Currency Volatility Really Means
Volatility is the amount a currency pair moves in a set timeframe. A small swing usually signals stability, while a big move can mean uncertainty or a major event. Understanding this helps you react instead of guessing.
Traders use volatility to decide when to enter or exit. Businesses use it to plan their budgets and manage risk. Developers use it to build tools that depend on real-time exchange rates.
When you use volatility data correctly, it becomes a strong decision anchor. You can see how one currency behaves next to another. You can also spot unusual patterns that deserve extra attention.
Why Volatility Matters In Real Work
If your product or workflow depends on accurate pricing, volatility matters a lot. A small difference in an exchange rate can change profits, loss margins, or forecasting results. You want clear visibility before making a move.
Many teams rely on historical data to check how a currency behaved in similar conditions. They want context before drawing conclusions or adjusting long-term plans. Having this information in one place saves hours of digging.
Developers who work with global services often need a stable foreign exchange data source. A platform that offers intuitive foreign exchange rates APIs and consistent responses makes the whole process smoother. When the structure stays predictable, everything you build stays predictable too.
Meet The Fluctuation Endpoint
The Fluctuation endpoint tells you how much a currency shifted between two dates. You get the start rate, the end rate, the numerical change, and the percentage change. All of this lands in one clean response.
You can filter by a base currency and track several currencies at the same time. This helps you spot patterns across groups instead of checking one pair at a time. It also supports quick comparison between regions and markets.
When you make foreign exchange rates api requests, you pass your foreign exchange rates api key and the details you care about. You get a clear breakdown for each currency code you include. The structure stays consistent no matter how wide your comparisons become.
How To Use The Endpoint (With Code)
Here is the standard Fluctuation endpoint structure:
GET https://api.currencyfreaks.com/v2.0/rates/fluctuation

  ?apikey=YOUR_API_KEY

  &start_date=YYYY-MM-DD

  &end_date=YYYY-MM-DD

  &base=USD

  &symbols=EUR,GBP,JPY
Below is an example request in Python:
import requests


url = "https://api.currencyfreaks.com/v2.0/rates/fluctuation"

params = {

    "apikey": "YOUR_API_KEY",

    "start_date": "2024-01-01",

    "end_date": "2024-01-15",

    "base": "USD",

    "symbols": "EUR,GBP,JPY"

}


response = requests.get(url, params=params).json()

print(response)
This gives a clean and predictable result. You get the start and end numbers, along with the change for each currency. It saves time when you want quick clarity.
How To Read The Results Clearly
The numbers you get may look simple, but they carry a lot of meaning. A positive change tells you the base currency strengthened. A negative change tells you it weakened.
Seeing the start rate and end rate side by side gives clarity fast. You can track whether the shift was mild or dramatic. You can also check how it compares to other currencies in the same window.
The percent change is often the most useful number. It shows the size of the move relative to the starting point. This makes it easier to compare currencies that sit on very different absolute values.
Visualizing The Movement (With Code)
A simple bar chart helps you see which currencies moved the most. It makes volatility easier to digest at a glance. Even basic libraries make this simple.
import matplotlib.pyplot as plt


currencies = ["EUR", "GBP", "JPY"]

changes = [response["rates"][c]["change_pct"] for c in currencies]


plt.bar(currencies, changes)

plt.title("Percentage Change from Start to End Date")

plt.ylabel("Change (%)")

plt.show()
You can also build heatmaps or trend lines with other tools. Visuals help when you need to explain movements to a team. They also help you notice patterns that numbers alone might hide.
How Different Teams Use This Data
Finance teams check volatility to plan purchases and manage international invoices. They want consistency and want to avoid hidden fees professional level costs that surprise them later. Having a clear picture lets them set expectations early.
Developers use the currency api to build dashboards, pricing tools, and reporting apps. They want data they can trust and endpoints that stay steady. They rely on extensive documentation when implementing new features.
Businesses use the latest exchange rates to keep prices fair for customers. No one likes unexpected jumps at checkout. Clean foreign exchange rates api integration keeps things transparent for everyone.
Traders rely on historical exchange rates when studying long-term patterns. They compare past reactions to current events. This helps them stay grounded when preparing new strategies.
How Fluctuation Compares To Other Endpoints
The Fluctuation endpoint shows how much a currency moved between two points in time. It works best when you want a clean window to analyze. The numbers are simple but powerful.
The Latest Rates endpoint gives the most current values. It helps with live dashboards and quick decisions. It’s also perfect for currency conversion moments.
The Timeseries endpoint covers a longer range of historical foreign exchange numbers. You can observe behavior across months or years. This level of context helps when planning forward.
Using all endpoints gives you a balanced view. You get short-term, long-term, and real-time movement. This makes any volatility analysis more reliable.
Best Practices When Working With Volatility
Stick to consistent date windows so your comparisons stay fair. Small shifts can distort the picture more than you expect. Clean alignment helps you make confident decisions.
Avoid weekends and market holidays when reviewing shifts. Activity drops, especially around major institutions like the European Central Bank, and rates often appear flat or misleading. This keeps your insights grounded.
Log your results when running repeated checks. Over time, patterns appear naturally. These insights help with forecasting and planning.
Common Issues And Fixes
Invalid dates are a frequent source of confusion. Double-check that your end date comes after your start date. A simple fix often solves the problem.
Symbol mistakes also cause issues. Make sure the currency codes match what you want to track. A quick scan helps avoid confusion.
Rate limits may interrupt rapid testing. Adding a retry block keeps things stable. Here’s one example:
import time


for i in range(3):

    try:

        response = requests.get(url, params=params)

        response.raise_for_status()

        break

    except:

        time.sleep(2)
Using the wrong base currency can create misleading results. Choose one that makes sense for your comparison. Once you do that, everything lines up cleanly.
Why CurrencyFreaks Helps With Volatility Work
Developers and analysts want reliable numbers and fast access. CurrencyFreaks focuses on accuracy sourced from commercial sources that meet high standards. You get easy access to many currencies without extra effort.
You get hourly updates that keep your insights fresh. You get more premium features when you move to the higher tiers. It works for commercial use, gives you effortless integration, and fits into whatever setup you already have.
The platform offers helpful email support for customers who need guidance. You also get access to platinum support click, which is great for teams that need priority roadmap input or want to join a quarterly briefing call.
The team also reviews product management feature requests, so users can share what they want improved or added. Even in the unlikely event that something goes wrong, the team will happily refund any latest payment tied to an issue.
For businesses that want stability, the pricing plans also offer annual billing. Free tiers are available for light usage. This gives you room to test the rest foreign exchange rates api before upgrading.
Analyze Volatility With a Foreign Exchange Rates API
1. Folder & Project Setup
Create a folder using the command prompt:
mkdir fluctuation_dataset
Open the folder inside Visual Studio Code:
cd fluctuation_dataset

code .
Create a Python file named:
fluctuation_app.py
2. Python Code Example
Paste the following code into fluctuation_app.py:
from flask import Flask, render_template

import requests

import pandas as pd


app = Flask(__name__)


API_KEY = "YOUR-API-KEY"

BASE = "USD"

SYMBOLS = ["EUR", "GBP", "JPY", "PKR", "CAD"]

START_DATE = "2022-10-01"

END_DATE = "2025-10-01"

URL = "https://api.currencyfreaks.com/v2.0/fluctuation"


@app.route("/")

def dashboard():

    params = {

        "apikey": API_KEY,

        "startDate": START_DATE,

        "endDate": END_DATE,

        "base": BASE,

        "symbols": ",".join(SYMBOLS)

    }

    response = requests.get(URL, params=params)

    data = response.json()["rateFluctuations"]


    rows = []

    for currency, values in data.items():

        rows.append({

            "Currency": currency,

            "Start Rate": float(values["startRate"]),

            "End Rate": float(values["endRate"]),

            "Change": float(values["change"]),

            "Percent Change (%)": float(values["percentChange"])

        })


    df = pd.DataFrame(rows)

    return render_template(

        "index.html",

        table=df.to_html(index=False, classes="table table-hover table-striped"),

        start_date=response.json()["startDate"],

        end_date=response.json()["endDate"]

    )


if name == "__main__":

    app.run(debug=True)
3. Instructions to Run
-
Add your API key at the placeholder before running the code.
-
Activate a virtual environment:
python -m venv .venv

.venv\Scripts\activate
- Install required libraries:
pip install requests pandas
- Run the code:
python fluctuation_app.py
6. For Showing Data in Table (index.html)
Create a file index.html in the same folder with this content:
<!DOCTYPE html>

<html>

<head>

    <title>FX Dataset Dashboard</title>

    <link href="https://cdn.jsdelivr.net/npm/bootstrap@5.3.0/dist/css/bootstrap.min.css" rel="stylesheet"/>

    <link href="https://fonts.googleapis.com/css2?family=Poppins:wght@300;400;600;700&display=swap" rel="stylesheet">


<style>

        body {

            background: linear-gradient(135deg, #1e1f29, #2a2d3e);

            font-family: 'Poppins', sans-serif;

            color: #fff;

            padding-bottom: 150px;

        }

        .dashboard-title {

            text-align: center;

            font-size: 32px;

            font-weight: 700;

            margin-top: 100px;

            text-transform: uppercase;

            letter-spacing: 2px;

        }

        .glass-card {

            margin-top: 30px;

            background: rgba(255,255,255,0.08);

            border-radius: 16px;

            backdrop-filter: blur(10px);

            padding: 20px;

            border: 1px solid rgba(255,255,255,0.15);

            box-shadow: 0 4px 25px rgba(0,0,0,0.3);

        }

        table th {

            background: #4CAF50 !important;

            color: white !important;

            text-align: center;

            padding: 16px;

        }

        table td {

            color: #eee;

            text-align: center;

            padding: 16px;

        }

        table tbody tr:hover {

            background: rgba(255,255,255,0.07);

        }

        .date-range {

            text-align: center;

            margin-bottom: 15px;

            font-weight: 500;

            font-size: 18px;

            color: #4CAF50;

        }

    </style>

</head>

<body>


<h2 class="dashboard-title">Analyze Volatility With a Foreign Exchange Rates API</h2>

<div class="container glass-card">

    <div class="date-range">

        Showing data from <b>{{ start_date }}</b> to <b>{{ end_date }}</b>

    </div>

    <h4><b>USD Foreign Exchange Volatility</b></h4>

    <div class="table-responsive">

        {{ table | safe }}

    </div>

</div>

<script src="https://cdn.jsdelivr.net/npm/bootstrap@5.3.0/dist/js/bootstrap.bundle.min.js"></script>

</body>

</html>
4. Output Example
The dashboard will show:
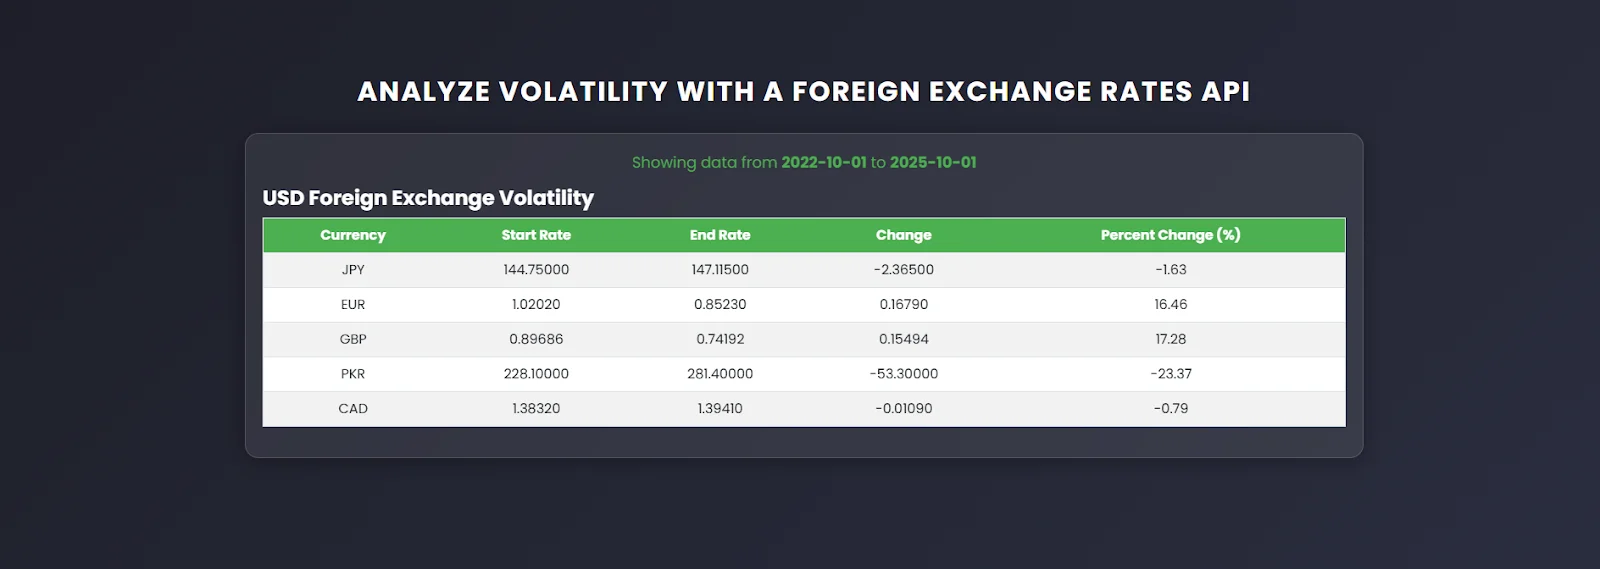
5. How Fluctuation API Works
The Fluctuation endpoint of a foreign exchange rates api calculates the movement of each currency between a selected start and end date. For every currency, it provides the Start Rate, which is the rate at the beginning of the period, the End Rate at the end of the period, the absolute Change in value, and the relative Percent Change (%). This dataset can be used for various purposes, including volatility analysis, financial reporting, dashboard visualizations, and trading or forecasting studies.
Conclusion
Volatility analysis becomes much clearer when you use the right tools with a currency api. With the Fluctuation endpoint and the wider CurrencyFreaks ecosystem, you get a simple and reliable way to understand how currencies move. It gives developers, analysts, and businesses clarity when they need it.
You now have a complete picture of how currency movement works. You also know how to pair it with historical exchange and other endpoints for deeper insight. When you grasp the fundamentals, everything else feels simpler.
FAQs
What Is The Fluctuation Endpoint Used For?
This helps to analyze how exchange rates change between two dates. You get absolute change, percentage change, and a clear breakdown for each currency. This makes volatility easy to understand.
How Accurate Is The Data From The Foreign Exchange Rates API?
CurrencyFreaks uses commercial sources that meet strict standards. The data stays consistent and reliable for analysis. Developers and finance teams use it confidently. There are so many other intuitive apis in the market but CurrencyFreaks comes with the most reliable and affordable solution without any issue access.
Can I Analyze Multiple Currencies In One Request?
Yes, you can add several symbols in a single call. Just separate them with commas. The response includes each one neatly.
Does The Foreign Exchange Rates API Support Historical Volatility?
Yes, you can get historical movement through the Fluctuation endpoint. You can also combine it with Timeseries for deeper patterns. Both work well for long-term study.
Do I Need A Paid Plan To Use The Fluctuation Endpoint?
It comes with some plans, and you’ll need a higher tier for the rest. Paid tiers unlock larger ranges and more features. You can pick what fits your business.
Ready to explore your own volatility data? Try CurrencyFreaks and start testing the Fluctuation endpoint today.


