
Markets have a habit of surprising you, which is exactly why the past is worth paying attention to. Every swing and slowdown tells a small story about how prices react. Put together, those stories power models, forecasts, and real decisions built on Historical Forex Data.
Batch workflows demand clean access to historical data at scale for consistent research outputs. Analysts rely on structured data files to test ideas quickly, safely, and repeatably. This approach keeps data science pipelines stable, auditable, and easier to validate over time.
The CurrencyFreaks API simplifies large historical pulls for serious workflows. It delivers real-time and historical forex data across currencies, crypto, and metals reliably. Free forex historical data download options support portfolio analysis, risk testing, and long-term forecasting accuracy.
Understanding Historical FX Data
Understanding Historical Forex Data starts with knowing what data you are actually working with. Spot rates show daily closing values for each currency pair. Time series data lets you follow historical exchange rates across extended time ranges.
Fluctuation metrics tell you how much a price actually moves during a given period. They matter when you run technical analysis on real market behavior. This data brings out volatility, momentum, and small changes hidden inside tick data.
Batch access to historical forex data makes large-scale research practical and efficient. Teams can import data in bulk without delays or manual effort. This makes technical analysis more accurate across long timelines.
Machine learning workflows rely on stable and repeatable inputs. Models need thousands of clean data points to learn patterns. Batch downloads make that possible without slowing analysis or breaking pipelines.
Getting Started with CurrencyFreaks API
Getting started with CurrencyFreaks is simple, even if you are new to forex markets. You just sign up, log in, and grab your API key; it only takes a moment. That one key is all you need to start pulling your Historical Forex Data across different currency pairs for trading strategies.
Sign Up & API Key Generation
Signing up is quick and easy, not time consuming at all. You enter basic details and instantly access your dashboard, which works like a central history center. From there, your personal API key sits clearly at the top.
Free vs Paid Plans
CurrencyFreaks gives you a few plan options to choose from. The free tier works well for forward testing, technical indicators, or small experiments. Paid plans suit heavier use across multiple forex markets and larger datasets.
Where to Find Your API Key
Your API key shows up right inside your dashboard when using the forex historical data api. You will find it under the API Access section for easy access. You can create a new key whenever you want.
API Security
Security matters when working with currency data and trading strategies. Keep your API key private so your technical indicators stay protected. Do not put it in browser code or anywhere people can see it.
Best Practices
-
Store the key in environment variables
-
Use server-side calls for sensitive workflows
-
Regenerate the key if you suspect exposure
SSL Encryption
All CurrencyFreaks endpoints use SSL encryption. This keeps every request protected from start to finish. It ensures reliable responses for analysis and forward testing.
Avoiding Client-Side Exposure of API Key
Never expose API keys in a browser app or any forex historical data app. Send API requests through your backend. This keeps access secure and helps avoid misuse.
Response Formats
CurrencyFreaks lets you choose from a few response formats, depending on how you like to work with data. JSON is the default and easy to work with. You can also use comma separated values when exporting data.
You can load forex historical data CSV files straight into Google Sheets or notebooks with no extra hassle. Whether you track different currency pairs or build models, forex historical data download free workflows stay simple and flexible.
API Endpoints for Historical Data
-
Historical Rates Endpoint
-
URL: /v2.0/rates/historical?apikey=YOUR_APIKEY&date=YYYY-MM-DD
-
Parameters: date, base, symbols
-
Example curl request & response
-
Time Series Endpoint
-
URL: /v2.0/timeseries?apikey=YOUR_APIKEY&startDate=YYYY-MM-DD&endDate=YYYY-MM-DD&base=USD&symbols=EUR,GBP,JPY
-
Benefits over single-date queries
-
Fluctuation Endpoint
-
URL: /v2.0/fluctuation?apikey=YOUR_APIKEY&startDate=YYYY-MM-DD&endDate=YYYY-MM-DD&symbols=USD,EUR
-
Use cases for volatility analysis
Access complete CurrencyFreaks endpoints and documentation here.
Batch Download Workflow
Before you run this code, you must have Python installed on your system. You can download the latest version of Python from: https://www.python.org/downloads/
Next, you should create a folder in your system to keep the Python file.
Create a Python file and name it "forex_analysis"
Next, open a terminal and activate the virtual environment.
For this code to run, you need these Python libraries:
-
requests for making API calls
-
pandas for data handling and manipulation
-
matplotlib for drawing charts
-
mplfinance for candlestick charts
You can install them using pip with this single command:
pip install requests pandas matplotlib mplfinance
-
This code fetches currency exchange data from CurrencyFreaks API.
-
It lets the user choose dates, currencies, and the type of data endpoint.
-
Then it either saves the data as a CSV or draws a chart.
-
Charts can be line, bar, or candlestick, depending on user choice.
Here is the complete code with output screenshots:
import requests
import pandas as pd
import matplotlib
matplotlib.use("Agg") # Avoid Tkinter GUI issues
import matplotlib.pyplot as plt
import mplfinance as mpf
import os
# ---------- CONFIG ----------
API_KEY = "add-your-api-key" # <-- Your CurrencyFreaks API key
BASE_URL = "https://api.currencyfreaks.com/v2.0"
# ----------------------------
# Fetch supported currency symbols
def get_supported_currencies():
url = f"{BASE_URL}/currency-symbols"
response = requests.get(url)
data = response.json()
return data.get("currencySymbols", {})
currencies = get_supported_currencies()
print("Supported currencies (first 50 shown for brevity):")
for code, name in list(currencies.items())[:50]:
print(f"{code} - {name}")
# ---------- USER INPUT ----------
base_currency = input("Enter base currency code (e.g., USD): ").upper()
symbol_currency = input("Enter symbol currency code (e.g., EUR): ").upper()
start_date = input("Enter start date (YYYY-MM-DD): ")
end_date = input("Enter end date (YYYY-MM-DD): ")
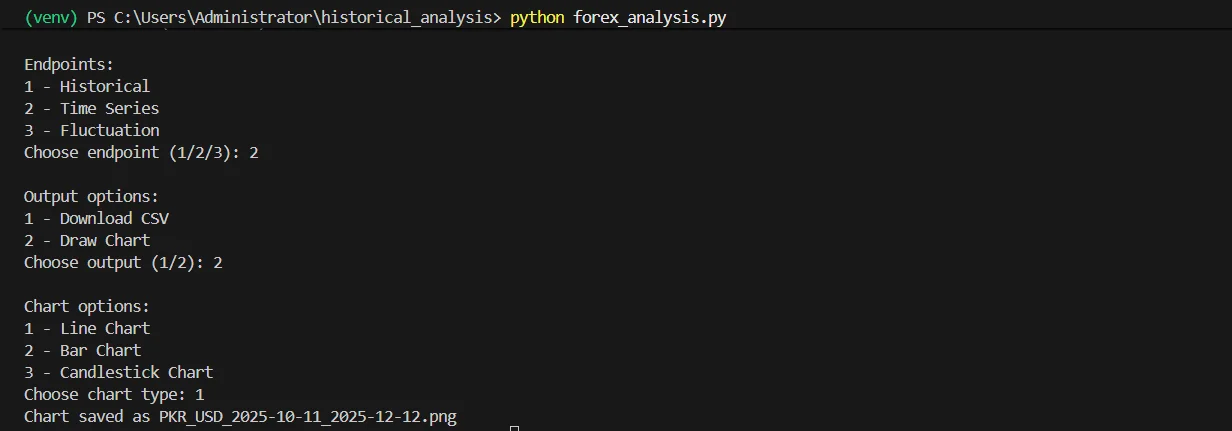
print("\nEndpoints:\n1 - Historical\n2 - Time Series\n3 - Fluctuation")
endpoint_choice = input("Choose endpoint (1/2/3): ")
print("\nOutput options:\n1 - Download CSV\n2 - Draw Chart")
output_choice = input("Choose output (1/2): ")
chart_type = None
if output_choice == "2":
print("\nChart options:\n1 - Line Chart\n2 - Bar Chart\n3 - Candlestick Chart")
chart_type = input("Choose chart type: ")
# ---------- API CALL ----------
def fetch_data():
if endpoint_choice == "1": # Historical
dates = pd.date_range(start=start_date, end=end_date)
all_data = []
for d in dates:
url = f"{BASE_URL}/rates/historical?apikey={API_KEY}&date={d.strftime('%Y-%m-%d')}&base={base_currency}&symbols={symbol_currency}"
r = requests.get(url).json()
rate = r.get("rates", {}).get(symbol_currency)
all_data.append({"Date": d.strftime("%Y-%m-%d"), "Rate": float(rate) if rate else None})
return pd.DataFrame(all_data)
elif endpoint_choice == "2": # Time Series
url = f"{BASE_URL}/timeseries?apikey={API_KEY}&startDate={start_date}&endDate={end_date}&base={base_currency}&symbols={symbol_currency}"
r = requests.get(url).json()
data_list = r.get("historicalRatesList", [])
all_data = [{"Date": d["date"], "Rate": float(d["rates"].get(symbol_currency, 0))} for d in data_list]
return pd.DataFrame(all_data)
elif endpoint_choice == "3": # Fluctuation
url = f"{BASE_URL}/fluctuation?apikey={API_KEY}&startDate={start_date}&endDate={end_date}&base={base_currency}&symbols={symbol_currency}"
r = requests.get(url).json()
rate_data = r.get("rateFluctuations", {}).get(symbol_currency, {})
all_data = [{"Date": start_date,
"StartRate": float(rate_data.get("startRate", 0)),
"EndRate": float(rate_data.get("endRate", 0)),
"Change": float(rate_data.get("change", 0)),
"PercentChange": float(rate_data.get("percentChange", 0))}]
return pd.DataFrame(all_data)
df = fetch_data()
# ---------- OUTPUT ----------
# CSV download
if output_choice == "1":
filename = f"{base_currency}_{symbol_currency}_{start_date}_{end_date}.csv"
df.to_csv(filename, index=False)
print(f"CSV saved as {filename}")
# Chart output
elif output_choice == "2":
if chart_type in ["1", "2"]:
plt.figure(figsize=(12,6))
# Handle tiny numbers automatically
if endpoint_choice != "3" and df["Rate"].max() < 1:
# Convert to reciprocal if rates are very small
df["DisplayRate"] = 1 / df["Rate"]
ylabel = f"{symbol_currency} per {base_currency}"
else:
df["DisplayRate"] = df.get("Rate", df.get("EndRate", df.get("Close", 0)))
ylabel = "Rate"
x = pd.to_datetime(df["Date"])
y = df["DisplayRate"]
if endpoint_choice == "3": # Fluctuation chart
plt.bar(x, y, color='orange', alpha=0.7)
plt.title(f"{symbol_currency} Fluctuation ({base_currency})")
else:
if chart_type == "1": # Line
plt.plot(x, y, marker='o', color='blue', linewidth=2)
else: # Bar
plt.bar(x, y, color='skyblue', alpha=0.7)
plt.title(f"{base_currency} vs {symbol_currency}")
plt.ylabel(ylabel)
plt.xlabel("Date")
plt.grid(True, linestyle='--', alpha=0.5)
plt.xticks(rotation=45)
plt.tight_layout()
filename = f"{base_currency}_{symbol_currency}_{start_date}_{end_date}.png"
plt.savefig(filename)
print(f"Chart saved as {filename}")
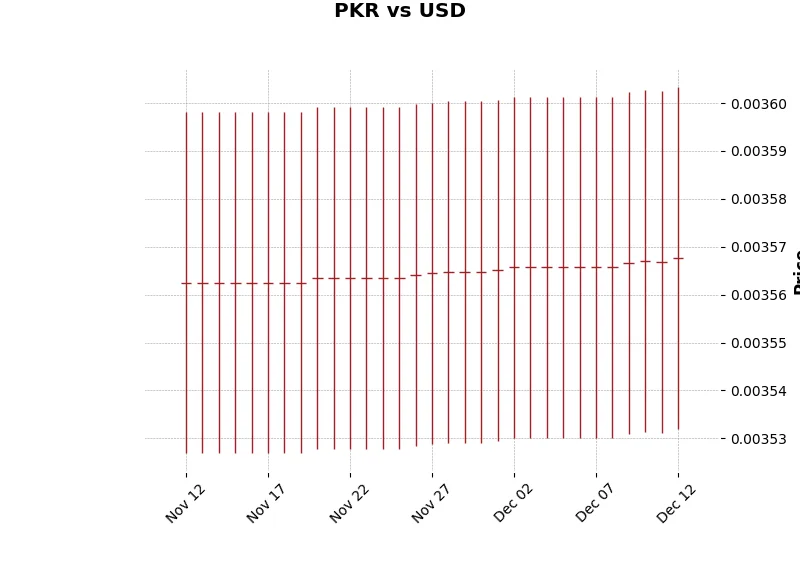
elif chart_type == "3": # Candlestick chart
if endpoint_choice != "2":
print("Candlestick chart only works for Time Series endpoint.")
else:
df_candle = df.copy()
df_candle["Open"] = df_candle["Rate"]
df_candle["Close"] = df_candle["Rate"]
df_candle["High"] = df_candle["Rate"] * 1.01
df_candle["Low"] = df_candle["Rate"] * 0.99
df_candle.index = pd.to_datetime(df_candle["Date"])
df_candle = df_candle[["Open","High","Low","Close"]]
filename = f"{base_currency}_{symbol_currency}_{start_date}_{end_date}_candlestick.png"
mpf.plot(df_candle, type='candle', style='charles', title=f"{base_currency} vs {symbol_currency}", volume=False, savefig=filename)
print(f"Candlestick chart saved as {filename}")
Next, run the code using the following command:
python forex_analysis.py
When you run the script, it first fetches a list of supported currencies from the CurrencyFreaks API. You can see the first 50 currencies printed, like AGLD (Adventure Gold), FJD (Fiji Dollar), ETHFI (ether.fi), and many more
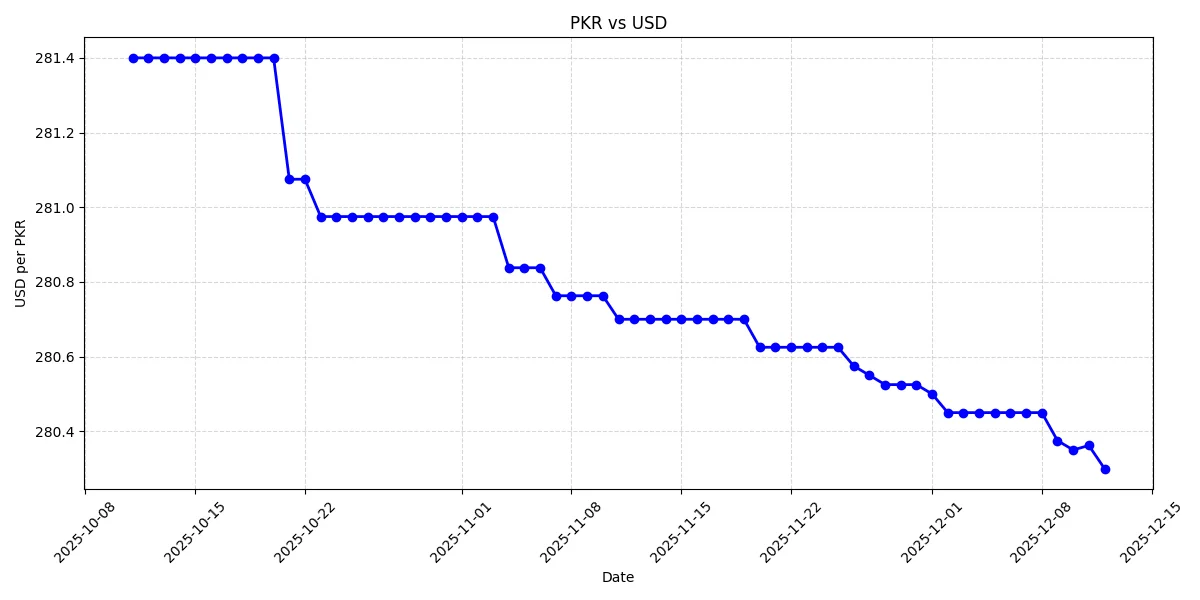
Next, the program asks the user to input a base currency (the currency you have, e.g., USD) and a symbol currency (the currency you want to compare against, e.g., PKR). You also provide a start date and end date for the data
Then, the script asks you to choose an endpoint type
-
Historical fetches daily rates for each date in your range
-
Time Series retrieves rates in a ready-made series
-
Fluctuation calculates changes between start and end dates
After that, you choose an output option
-
CSV download saves the data as a CSV file
-
Draw chart plots a line, bar, or candlestick chart
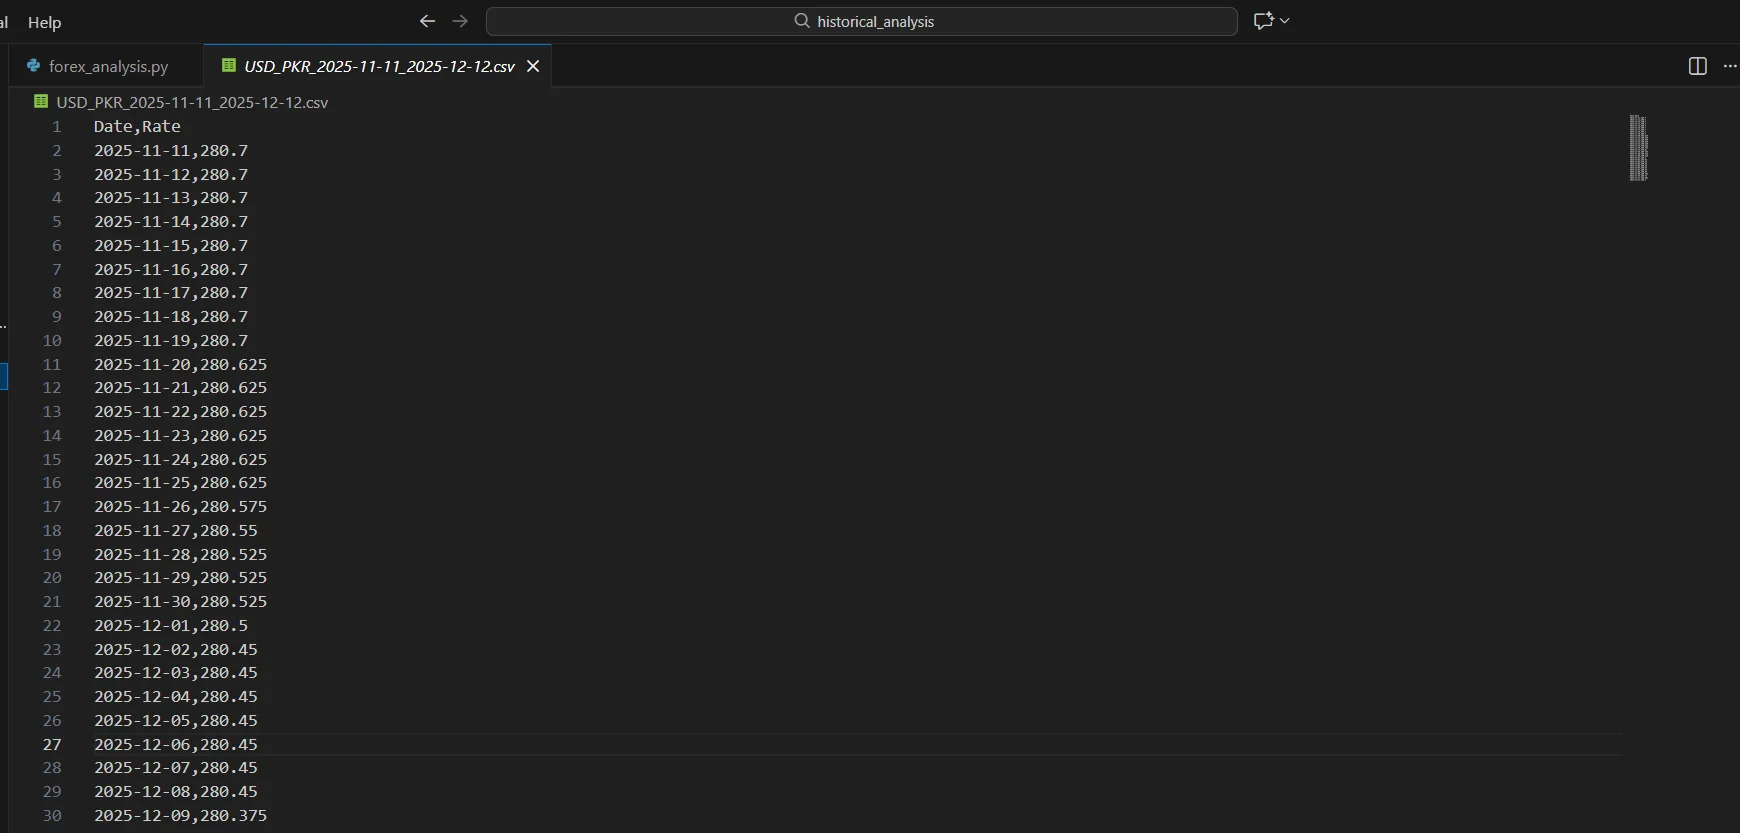
Now you have a ready-to-use CSV file with all the historical exchange rates, which you can analyze in Excel, Python, or any data tool.
Handling Errors & Rate Limits
Errors like 400, 401, 404, or 429 often break batch requests for historical Forex Data. This can happen even when exporting results in csv format or other formats. Typically, these values indicate a minor error, such as a missing parameter or an expired API key. Sometimes it just means you pushed the rate limit.
Adding retry logic in Python keeps your forex historical data download process steady for analysts and traders alike. Use short retry intervals, add exponential backoff, and stop the loop after a safe limit. This prevents your script from overwhelming the API or getting stuck in a long fail cycle.
Logging every failed call in forex trading historical data helps reveal long term trends over time. Clear logs make it easier to understand why a request broke and where it happened. Over time, these logs show clear patterns that help you improve your pipeline.
Integrating FX Data into Data Science Workflows
Working with Historical Forex Data in a data science workflow is pretty straightforward once it lands in Pandas or NumPy. You load the file, check the columns, and start shaping it the way you need. Nothing fancy, just clean data you can work with right away.
-
Many people grab free forex historical data when they just want a quick dataset to test ideas.
-
Others download a free forex historical data CSV because it slides into a dataframe without any effort.
-
JSON works too, especially if you want to keep things flexible while pulling free historical forex data into other scripts.
Merging FX data with market datasets often reveals patterns you don’t notice at first glance. You might compare currency moves with stocks or commodities.
You can also line them up with global indicators stored in different formats. Once the pieces line up, the relationships start to make sense.
These merged sets help with real analysis. You can map trends tied to the Japanese yen or spot shifts around the Turkish lira. Some teams train models to test simple forecasts.
Others explore legacy signals like the Croatian kuna. This workflow grows naturally as your project evolves.

Advanced Use Cases
Currency conversion using historical rates
When you work with past transactions, you need numbers that match the exact day. Historical Forex Data makes it easy to double-check old conversions without guessing. It also helps when you’re reviewing older reports or comparing results with Oanda forex historical data from other sources.
Fluctuation analysis for risk modeling
Some projects need a closer look at how fast the market moves. With forex 1 minute historical data, you can spot sudden swings that would never show up in daily snapshots. These tiny movements often reveal risks that matter later in real models.
Automating daily updates for dashboards
Most teams don’t want to refresh charts by hand every morning. Pulling Python forex historical data into a script keeps your dashboards updated without extra effort. This keeps your trends up to date, your alerts on point, and your decisions backed by real data.
Conclusion
Batch downloading Historical Forex Data makes your workflow faster and more consistent. You get clean, structured numbers right away. The numbers stay the same across different sources.
The CurrencyFreaks API delivers speed, wide coverage, and strong reliability. It also gives you historical forex data free. It’s easy to use and helps you understand how the market actually moves.
You can pull forex API historical data at scale. You can export results to Excel or any spreadsheet with ease. This improves model performance across dashboards and notebooks.
Now is the time to explore the platform. Fetch Historical Forex Data and start building smarter workflows. Sign up and use it in your projects today.
FAQs
Can I Download Historical FX Data For All Currencies At Once?
Yes, the Time Series endpoint lets you fetch multiple currencies at once. Just be sure your plan can handle the request.
What Date Range Is Available For Historical Data?
Most currencies go back to the 1980s. You can check the exact coverage through the Historical Data Limits endpoint.
How Do I Handle API Rate Limits During Batch Downloads?
Use retries, slow your requests, or split big ranges into smaller parts. These steps help avoid hitting limits. Paid plans give you more space.
Can I Use A Custom Base Currency For Historical Rates?
Yes, paid plans let you switch the base currency with the base parameter.
What Formats Can I Receive The Data In?
You can get JSON by default or XML using the format=xml parameter.
How Do I Convert Historical FX Rates For Specific Amounts?
Use the conversion endpoint and fill in from, to, amount, and date. It will calculate the rate for you.
Is There A Way To Get Localized Currency Rates Automatically?
Yes, you can. The IP to Currency Conversion endpoint reads the visitor’s IP and returns their local currency. It comes with the Growth plan and higher.
Start working with clean historical forex data today using CurrencyFreaks. Pull reliable data and build smarter models with less effort.


