
Wondering how to make intelligent decisions in currency trading? That's where a Real-Time Exchange Rate API comes in. It gives you live data on currency values. One excellent API is CurrencyFreaks. It shows you real-time rates, historical data, and other fantastic features.
Now, what's a Forex Dashboard? It's like a control centre for currency traders. Just a simple screen showing essential info about money values – real-time updates, past trends, and easy-to-read charts.
Want to build your own Forex Dashboard? It's easy with CurrencyFreaks API. Follow along as we guide you step by step.
What is a Real-Time Exchange Rate API?
Areal-time exchange rate API is an application programming interface that gives you the live data. In other words, you get the desired exchange rate data within real-time. Some real-time series data API also come with historical data for currencies. One such example is CurrencyFreaks that allows the following endpoints other than the real-time exchange rate data.
-
Desired Currencies Rates Only
-
Change Base Currency
-
Historical Rates
-
Fluctuation
-
Time Series
-
Historical Rates Conversion
-
IP To Currency
What is a Forex Dashboard?
A Forex Dashboard is like a smart tool for people who trade currencies. It's a simple screen that shows important information about money values. Think of it as a control center on your computer or phone. It gives you real-time updates on how much one currency is worth compared to another, shows past trends, and has easy-to-read charts. This helps traders make quick and smart decisions.
Can We Build a Forex Dashboard with Real-Time Currency API?
It is easier to create a forexdashboard using the CurrencyFreaks API. Let's show you how.
Building a Sample Dashboard
Get Your API Key
Create account at CurrencyFreaks and get your API key through the dashboard.
Implement API Key Using the Python Code
Import Libraries
import requests
import tkinter as tk
from tkinter import Label, Entry, Button, messagebox, ttk
import matplotlib.pyplot as plt
from matplotlib.backends.backend_tkagg import FigureCanvasTkAgg
from PIL import Image, ImageTk
from datetime import date, timedelta
Our code uses Python's requests library to fetch data, tkinter for creating a graphical user interface, and matplotlib to plot graphs. It also utilizes the PIL library for image handling and date manipulation with datetime. It combines these elements to create a user-friendly application for data visualization and analysis.
Define Variable For API Key
# Replace 'YOUR_APIKEY' with the provided API key
api_key = 'YOUR_APIKEY'
Get Forex Rates
def get_forex_rate():
    source_currency = source_currency_var.get().upper()
    target_currency = target_currency_var.get().upper()
    amount = float(amount_entry.get())
    url = f'https://api.currencyfreaks.com/v2.0/convert/latest?apikey={api_key}&from={source_currency}&to={target_currency}&amount={amount}'

    try:
        response = requests.get(url)
        convert_button.config(state=tk.DISABLED)  # Disable the Convert button during execution

        if response.status_code == 200:
            data = response.json()
            converted_amount = data.get('convertedAmount')
            if converted_amount:
                result_label.config(text=f'{amount} {source_currency} is equal to {converted_amount} {target_currency}', fg="green")
                chart_button.config(state=tk.NORMAL)  # Enable the chart button after successful conversion
            else:
                result_label.config(text='Conversion data not found in the API response.', fg="red")
        else:
            result_label.config(text=f'Failed to retrieve data. Status code: {response.status_code}', fg="red")

    except requests.exceptions.RequestException as e:
        result_label.config(text=f'An error occurred: {e}', fg="red")
The function `get_forex_rate()` fetches real-time currency conversion rates using an API, displaying results with user-friendly messages and error handling. It ensures accurate and accessible currency conversion information for users. Therefore, enhancing our trading experience with a responsive interface.
Plot Forex Rates
def plot_chart():
    base_currency = source_currency_var.get().upper()
    symbols = target_currency_var.get().upper()

    # Get user-entered date
    user_date = date_entry.get()
    if user_date:
        start_date = user_date
    else:
        # Fetch rates for the last 30 days if no specific date is provided
        start_date = (date.today() - timedelta(days=30)).isoformat()

    url = f'https://api.currencyfreaks.com/v2.0/timeseries?apikey={api_key}&startDate={start_date}&endDate={date.today().isoformat()}&base={base_currency}&symbols={symbols}'

    try:
        response = requests.get(url)
        chart_button.config(state=tk.DISABLED)  # Disable the Plot Chart button during execution

        if response.status_code == 200:
            data = response.json()
            historical_rates_list = data.get('historicalRatesList')
            if historical_rates_list:
                dates = [entry['date'] for entry in historical_rates_list]
                rates = [entry['rates'][symbols] for entry in historical_rates_list]

                fig, ax = plt.subplots(figsize=(8, 5))  # Adjust figure size as needed
                ax.plot(dates, rates, marker='o', label=f'{base_currency}/{symbols}')
                ax.set(xlabel='Date', ylabel=f'Forex Rate ({base_currency}/{symbols})', title='Historical Exchange Rates')
                ax.legend()

                # Set rotation and interval for x-axis labels
                ax.tick_params(axis='x', rotation=90, labelsize=8, which='major')

                fig.tight_layout()  # Set tight layout for better appearance

                canvas = FigureCanvasTkAgg(fig, master=root)
                canvas_widget = canvas.get_tk_widget()
                canvas_widget.grid(row=20, column=0, columnspan=60, pady=10)  # Updated row number

                canvas.draw()
            else:
                messagebox.showinfo("Information", "No historical data found for the selected currencies and date range.")
        else:
            messagebox.showerror("Error", f'Failed to retrieve data. Status code: {response.status_code}')

    except (ValueError, KeyError):
        messagebox.showerror("Error", "Error processing data for chart plotting.")
    except requests.exceptions.RequestException as e:
        messagebox.showerror("Error", f'An error occurred: {e}')
The function `plot_chart()` takes user-inputted currency symbols, fetches historical exchange rates, and plots a chart for analysis. It uses the CurrencyFreaks API and disables the button during execution. If successful, it displays a chart with dates on the x-axis and exchange rates on the y-axis, providing insights into the historical performance of the selected currencies. Error messages are shown if there's an issue with data retrieval or processing.
Design Graphical User Interface
# GUI setup
root = tk.Tk()
root.title("Forex Dashboard")

# Add background image
bg_image_url = "https://currencyfreaks.com/pics/blog/reliable-exchange-rate-data.webp?v=0.1"
bg_image = Image.open(requests.get(bg_image_url, stream=True).raw)
bg_image = bg_image.resize((500, 600), Image.LANCZOS)  # Corrected resizing method
bg_image = bg_image.convert("RGBA")
bg_image_with_transparency = Image.new("RGBA", bg_image.size, (255, 255, 255, 128))  # 128 is the transparency level
bg_image = Image.alpha_composite(bg_image_with_transparency, bg_image)
background_image = ImageTk.PhotoImage(bg_image)

background_label = Label(root, image=background_image)
background_label.place(relwidth=1, relheight=1)

# Styling
root.geometry("500x600")
root.configure(bg="blue")  # Set the background color to white or any color you prefer

# Labels and entries
labels = ["Amount to Convert:"]

# Declare entry variables in the global scope
amount_entry = None

for i, text in enumerate(labels):
    label = Label(root, text=text, bg="white")
    label.grid(row=i * 2 + 1, column=0, padx=10, pady=5, sticky="e")

    entry = Entry(root)
    entry.grid(row=i * 2 + 1, column=1, padx=10, pady=5, sticky="w")

    # Assign entry variables in the global scope
    if text.startswith("Amount"):
        amount_entry = entry

# Currency dropdowns
currency_label = Label(root, text="Select Currencies:", bg="white")
currency_label.grid(row=3, column=0, padx=10, pady=5, sticky="e")

currencies = ["PKR", "USD", "EUR", "GBP", "JPY", "CAD"]  # Add more currencies if needed
source_currency_var = tk.StringVar(value=currencies[0])
target_currency_var = tk.StringVar(value=currencies[1])

source_currency_dropdown = ttk.Combobox(root, textvariable=source_currency_var, values=currencies)
source_currency_dropdown.grid(row=3, column=1, padx=10, pady=5, sticky="w")

target_currency_dropdown = ttk.Combobox(root, textvariable=target_currency_var, values=currencies)
target_currency_dropdown.grid(row=3, column=2, padx=10, pady=5, sticky="w")

# Add validation function
def validate_source_currency(*args):
    source_currency = source_currency_var.get()
    if source_currency not in currencies:
        source_currency_var.set(currencies[0])  # Set to default if invalid
        messagebox.showwarning("Invalid Currency", "Please select a valid source currency.")

# Attach the validation function to the variable
source_currency_var.trace_add("write", validate_source_currency)

# Buttons
convert_button = Button(root, text="Convert", command=get_forex_rate, bg="#4CAF50", fg="white")
convert_button.grid(row=4, column=0, columnspan=2, pady=10)  # Adjusted row number

result_label = Label(root, text="", font=("Helvetica", 12), fg="black", bg="white")
result_label.grid(row=5, column=0, columnspan=2, pady=10)

chart_button = Button(root, text="Plot Chart", command=plot_chart, state=tk.DISABLED, bg="#008CBA", fg="white")
chart_button.grid(row=6, column=0, columnspan=2, pady=10)  # Adjusted row number

# Entry for user to input the historical rate date
date_label = Label(root, text="Enter Historical Rate Date (YYYY-MM-DD):", bg="white")
date_label.grid(row=7, column=0, padx=10, pady=5, sticky="e")

date_entry = Entry(root)
date_entry.grid(row=7, column=1, padx=10, pady=5, sticky="w")

# Configure row and column weights for responsive resizing
for i in range(8):
    root.grid_rowconfigure(i, weight=1)
    root.grid_columnconfigure(0, weight=1)

root.mainloop()
This code sets up a Forex Dashboard using Tkinter in Python. It includes GUI elements for currency conversion, chart plotting, and date input. The background features an image. Dropdowns allow currency selection, with validation for the source currency. Buttons trigger conversion and chart plotting functions. Responsive resizing is ensured with row and column weights.
Final Code
import requests
import tkinter as tk
from tkinter import Label, Entry, Button, messagebox, ttk
import matplotlib.pyplot as plt
from matplotlib.backends.backend_tkagg import FigureCanvasTkAgg
from PIL import Image, ImageTk
from datetime import date, timedelta

# Replace 'YOUR_APIKEY' with the provided API key
api_key = 'YOUR_APIKEY'

def get_forex_rate():
    source_currency = source_currency_var.get().upper()
    target_currency = target_currency_var.get().upper()
    amount = float(amount_entry.get())
    url = f'https://api.currencyfreaks.com/v2.0/convert/latest?apikey={api_key}&from={source_currency}&to={target_currency}&amount={amount}'

    try:
        response = requests.get(url)
        convert_button.config(state=tk.DISABLED)  # Disable the Convert button during execution

        if response.status_code == 200:
            data = response.json()
            converted_amount = data.get('convertedAmount')
            if converted_amount:
                result_label.config(text=f'{amount} {source_currency} is equal to {converted_amount} {target_currency}', fg="green")
                chart_button.config(state=tk.NORMAL)  # Enable the chart button after successful conversion
            else:
                result_label.config(text='Conversion data not found in the API response.', fg="red")
        else:
            result_label.config(text=f'Failed to retrieve data. Status code: {response.status_code}', fg="red")

    except requests.exceptions.RequestException as e:
        result_label.config(text=f'An error occurred: {e}', fg="red")

def plot_chart():
    base_currency = source_currency_var.get().upper()
    symbols = target_currency_var.get().upper()

    # Get user-entered date
    user_date = date_entry.get()
    if user_date:
        start_date = user_date
    else:
        # Fetch rates for the last 30 days if no specific date is provided
        start_date = (date.today() - timedelta(days=30)).isoformat()

    url = f'https://api.currencyfreaks.com/v2.0/timeseries?apikey={api_key}&startDate={start_date}&endDate={date.today().isoformat()}&base={base_currency}&symbols={symbols}'

    try:
        response = requests.get(url)
        chart_button.config(state=tk.DISABLED)  # Disable the Plot Chart button during execution

        if response.status_code == 200:
            data = response.json()
            historical_rates_list = data.get('historicalRatesList')
            if historical_rates_list:
                dates = [entry['date'] for entry in historical_rates_list]
                rates = [entry['rates'][symbols] for entry in historical_rates_list]

                fig, ax = plt.subplots(figsize=(10, 5))  # Adjusted figure size
                fig.subplots_adjust(left=0.1, right=0.9, top=0.85, bottom=0.2)  # Adjusted top margin
                ax.plot(dates, rates, marker='o', label=f'{base_currency}/{symbols}')
                ax.set(xlabel='Date', ylabel=f'Forex Rate ({base_currency}/{symbols})', title='Historical Exchange Rates')
                ax.legend()

                # Set rotation and interval for x-axis labels
                ax.tick_params(axis='x', rotation=45, labelsize=8, which='major')
                ax.tick_params(axis='y', rotation=0, labelsize=8, which='major', pad=10)

                fig.tight_layout()  # Set tight layout for better appearance

                canvas = FigureCanvasTkAgg(fig, master=root)
                canvas_widget = canvas.get_tk_widget()
                canvas_widget.grid(row=8, column=0, columnspan=3, padx=10, pady=20)

                canvas.draw()
            else:
                messagebox.showinfo("Information", "No historical data found for the selected currencies and date range.")
        else:
            messagebox.showerror("Error", f'Failed to retrieve data. Status code: {response.status_code}')

    except (ValueError, KeyError):
        messagebox.showerror("Error", "Error processing data for chart plotting.")
    except requests.exceptions.RequestException as e:
        messagebox.showerror("Error", f'An error occurred: {e}')

# GUI setup
root = tk.Tk()
root.title("Forex Dashboard")

# Add background image
bg_image_url = "https://currencyfreaks.com/pics/blog/reliable-exchange-rate-data.webp?v=0.1"
bg_image = Image.open(requests.get(bg_image_url, stream=True).raw)
bg_image = bg_image.resize((800, 600), Image.LANCZOS)  # Corrected resizing method
bg_image = bg_image.convert("RGBA")
bg_image_with_transparency = Image.new("RGBA", bg_image.size, (255, 255, 255, 128))  # 128 is the transparency level
bg_image = Image.alpha_composite(bg_image_with_transparency, bg_image)
background_image = ImageTk.PhotoImage(bg_image)

background_label = Label(root, image=background_image)
background_label.place(relwidth=1, relheight=1)

# Styling
root.geometry("800x600")
root.configure(bg="blue")  # Set the background color to white or any color you prefer

# Labels and entries
labels = ["Amount to Convert:"]

# Declare entry variables in the global scope
amount_entry = None

for i, text in enumerate(labels):
    label = Label(root, text=text, bg="white")
    label.grid(row=i * 2 + 1, column=0, padx=10, pady=5, sticky="e")

    entry = Entry(root)
    entry.grid(row=i * 2 + 1, column=1, padx=10, pady=5, sticky="w")

    # Assign entry variables in the global scope
    if text.startswith("Amount"):
        amount_entry = entry

# Currency dropdowns
currency_label = Label(root, text="Select Currencies:", bg="white")
currency_label.grid(row=3, column=0, padx=30, pady=10, sticky="e")

currencies = ["PKR", "USD", "EUR", "GBP", "JPY", "CAD"]  # Add more currencies if needed
source_currency_var = tk.StringVar(value=currencies[0])
target_currency_var = tk.StringVar(value=currencies[1])

source_currency_dropdown = ttk.Combobox(root, textvariable=source_currency_var, values=currencies)
source_currency_dropdown.grid(row=3, column=1, padx=10, pady=5, sticky="w")

target_currency_dropdown = ttk.Combobox(root, textvariable=target_currency_var, values=currencies)
target_currency_dropdown.grid(row=3, column=2, padx=10, pady=5, sticky="w")

# Add validation function
def validate_source_currency(*args):
    source_currency = source_currency_var.get()
    if source_currency not in currencies:
        source_currency_var.set(currencies[0])  # Set to default if invalid
        messagebox.showwarning("Invalid Currency", "Please select a valid source currency.")

# Attach the validation function to the variable
source_currency_var.trace_add("write", validate_source_currency)

# Buttons
convert_button = Button(root, text="Convert", command=get_forex_rate, bg="#4CAF50", fg="white")
convert_button.grid(row=4, column=0, columnspan=2, pady=10)  # Adjusted row number

result_label = Label(root, text="", font=("Helvetica", 12), fg="black", bg="white")
result_label.grid(row=5, column=0, columnspan=2, pady=10)

chart_button = Button(root, text="Plot Chart", command=plot_chart, state=tk.DISABLED, bg="#008CBA", fg="white")
chart_button.grid(row=16, column=0, columnspan=20, pady=90)  # Adjusted row number

# Entry for the user to input the historical rate date
date_label = Label(root, text="Enter Historical Rate Date (YYYY-MM-DD):", bg="white")
date_label.grid(row=7, column=0, padx=10, pady=5, sticky="e")

date_entry = Entry(root)
date_entry.grid(row=7, column=1, padx=10, pady=5, sticky="w")

# Configure row and column weights for responsive resizing
for i in range(8):
    root.grid_rowconfigure(i, weight=1)
    root.grid_columnconfigure(0, weight=1)

root.mainloop()
Output
Run the code in Visual Studio Code and it will show you the below screen. This dashboard performs the following functions:
-
Converts one currency to another.
-
Shows currency rates for last 30 days.
-
Gives historical data for a particular date.
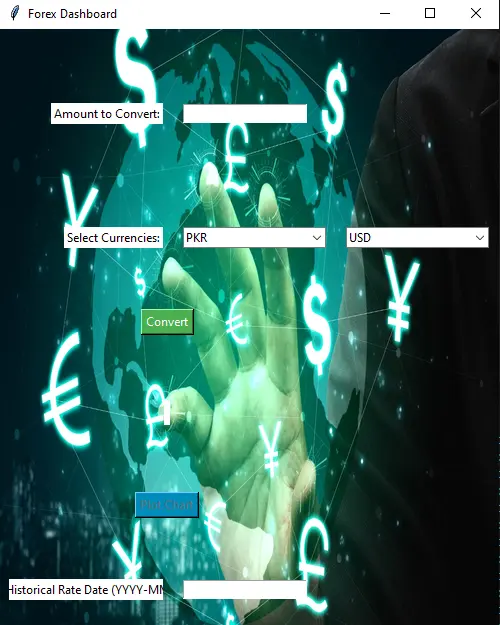
Enter the amount you want to convert. Then, insert the base and target currencies.
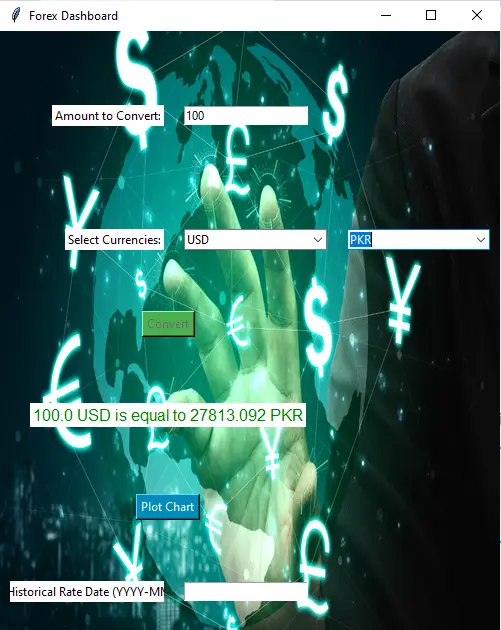
You can see that 100 US dollars equals 27813.092. Now, click on plot chart and it will show you the currency rates between the entered currencies for last thirty days.
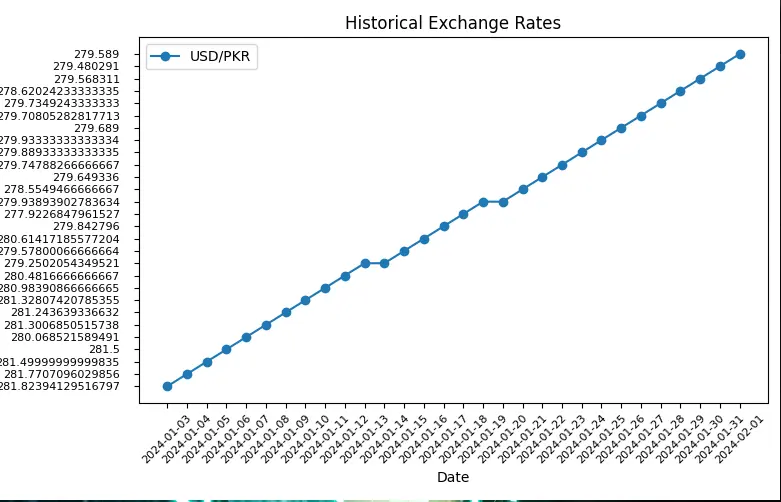
On the other hand, if you enter the historical date, it will give you exchange rate data for that particular date. That was all our Forex Dashboard covers.
Conclusion
In this article, we mainly focusedon creating a simple forex dashboard. For this purpose, we used CurrencyFreaks API requests volume with Python programming language. We added functionalities like converting a particular amount between two currencies. Moreover, we also added historical data. Besides, we also allowed users to fetch latest exchange rates for two currencies. Start with the free currency converter API — no credit card required.
FAQs
What is an Exchange Rate Data API?
An exchange rate data API helps us convert currencies to know a particular amount. In other words,we check the worth of one currency into another currency.
Is There a Free Historical Data API?
Yes. CurrencyFreaks gives you the option for free trial of their API.
How Do You Find the Real Currency Data?
You can fetch it using the exchange rate data APIs.
What Are the Applications Of a Forex Dashboard?
A Forex dashboard facilitates real-time monitoring of currency markets, aiding traders in making informed decisions for optimal financial outcomes.
Sign Up for free at CurrencyFreaks - Create reliable forex dashboards with a higher accuracy.